Download
1 / 7
80 likes | 217 Views
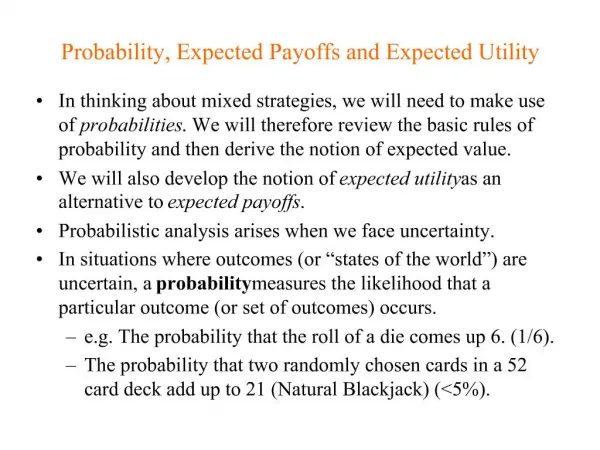
Example 3 Combination of expected value concept and utility function. Let’s assume that we have a project with two possible outcomes. The first outcome gives 200 mill NOK with probability of 80%.

E N D
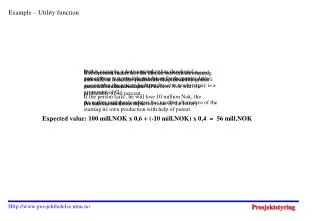
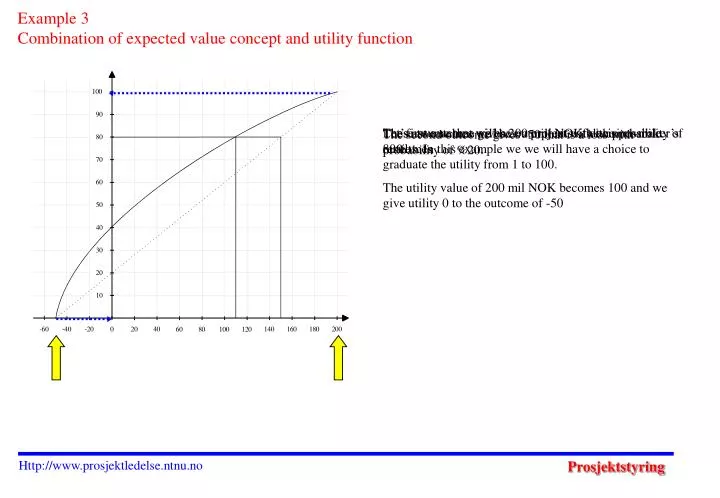
Example 3 Combination of expected value concept and utility function Let’s assume that we have a project with two possible outcomes The first outcome gives 200 mill NOK with probability of 80% These two values will be outerpoints of decision-maker’s results. In this example we we will have a choice to graduate the utility from 1 to 100. The utility value of 200 mil NOK becomes 100 and we give utility 0 to the outcome of -50 The second outcome gives -50 that is a loss with probability of %20. Http://www.prosjektledelse.ntnu.no
The dicision-maker in this example has a utility function which is shown in the figure and we can see that this person is risk-averse. This means that the person does not intend to take risk. We draw a line between these two outer points. This line applies to a person which is risk-neutral. We can use the expected value concept in this problem. The sum of these two expected values of project gives the total expected value of 150 mill NOK. 80 % of 200 : 160 mill. NOK + 20% of -50 : -10 mill. NOK = Expected value 150 mill. NOK Http://www.prosjektledelse.ntnu.no
If we draw a vertical line from the expected value, 150, and draw another horizontal line from its intersection with the line connecting two outer points, the horizontal line crosses the utility axis on 80. Now we go back from the utility value,80, until we cross utility function.from here we go straight down to the result and read the assured amount equal to 109 mill NOK. By being offered 109 mil NOK, the decision-maker becomes hesitant on choosing the sum or implementing the project. In case that the decision-maker gets a larger sum, he will choose the sum. In case of offering a sum less than 109 mill NOK he will choose to implement the project. Http://www.prosjektledelse.ntnu.no
Return Expected . return Probability Utility Expected . utility (mill.NOK.) (mill.NOK) 20 % 180 36 96 19.2 50 % 80 40 72 36.0 30 % -30 -9 22 6.6 Expected 67 61.8 A return of 80 mill NOK with aprobability of 50%. So we can calculate the expected return of this outcome: 50% of 80mill.NOK = 40 mill.NOK Let’s consider a project which uses the utility function which we have sketched for this decision-maker. This project has three possible outcomes. When we do not care risk-aversion of decision-maker. We should therefore convert the returns to utility and afterwards calculate an expected utility. A return of 180 mill NOK with a probability of 20%. We can also calculate the expected return of this outcome by using the expected value concept. The probability multiplied by utility: 20% of 180mill.NOK = 36 mill.NOK Finally we aggregate the expected returns and find the total expected value of project: 36 + 40 + (-9) = 67 A probability of 30% for a loss of 30 mill. NOK. We calculate the expected return of this outcome: 30% of -30mill.NOK = -9 mill.NOK Http://www.prosjektledelse.ntnu.no
100 90 80 70 60 50 40 30 20 10 -60 -40 -20 0 20 40 140 160 180 200 60 80 100 120 Return Expected . Return Probability Utility Expected . Utility (mill.NOK.) (mill.NOK) 20 % 180 36 96 19.2 50 % 80 40 72 36.0 30 % -30 -9 22 6.6 Expected 67 61.8 Accordingly we do for 80 mill.NOK and gain a utility of 72. For -30 mill.NOK there is a utility of 22. The utility value is listed in the fourth column. For 180 mill.NOK we go up until we intercept the utility function and continue furthur to the utility value axis. Here we can read a utility of 96. We go in detail for each of the three return values and read the utility in the figure. Http://www.prosjektledelse.ntnu.no
Return Expected . Return Probability Utility Expected . utility (mill.NOK.) (mill.NOK) 20 % 180 36 96 19.2 50 % 80 40 72 36.0 30 % -30 -9 22 6.6 Expected 67 61.8 We can now aggregate the expected utilities and gain: 19.2 + 36.0 + 6.6 = 61.8 This number does not say so much.it is an abstract concept and we will have something to do with that. We should convert it to an equivalent assured sum. The last outcome equal to -30 mill.NOK gives an expected utility of 6.6: 30% of 22 = 6.6 For an outcome with 80mill.NOK, it becomes: 50% of 72 = 36.0 For the outcome of 180mill.NOK we have a utility of 96 and this should be multiplied by the a probabiity on 20%. 20% of 96 = 19.2 This gives an expected utility of 19.2 Now we combine the expected value concept and the utility function and calculate the expected utility. Http://www.prosjektledelse.ntnu.no
100 90 80 70 60 50 40 30 20 10 -60 -40 -20 0 20 40 140 160 180 200 60 80 100 120 If the decision-maker is offered 45 nill.NOK, he will become hesitant concerning the choice on taking the sum or implementing the project with an expected value on 67 mill.NOK. If the decision-maker gets an offer larger than 45 mill.NOK, he will choose that. If the offer is less than 45mill.NOK which is the assured sum, he will implement the project. We look at the utility function go up Vi ser da på nyttefunksjonen og går inn på 61.8 på nytteverdien og bortover til vi treffer nyttefunksjonen. Derfra går vi ned på resultataksen og leser av en avkastning på 45 mill.NOK. Dette er en god del lavere enn den forventete avkastningen på 67 mill.NOK. Http://www.prosjektledelse.ntnu.no