Download
1 / 24
250 likes | 480 Views
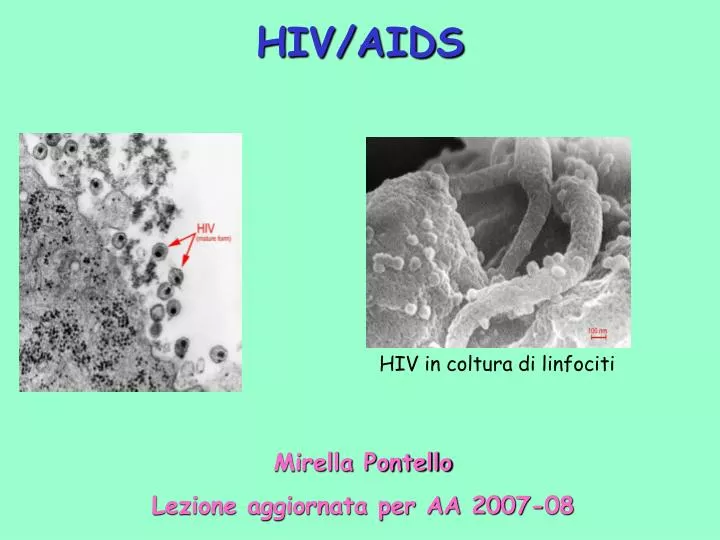
HIV/AIDS. HIV in coltura di linfociti. Mirella Pontello Lezione aggiornata per AA 2007-08. Patogenesi e storia naturale. Tre fasi: Infezione primaria da HIV Latenza clinica Fase sintomatica . 1 a fase. Infezione primaria da HIV:

E N D
HIV/AIDS HIV in coltura di linfociti Mirella Pontello Lezione aggiornata per AA 2007-08
Patogenesi e storia naturale • Tre fasi: • Infezione primaria da HIV • Latenza clinica • Fase sintomatica
1a fase • Infezione primaria da HIV: • a 2-6 settimane dal contagio sindrome clinica acuta di tipo “influenzale” – comparsa di marcatori di replicazione virale – elevata viremia – disseminazione del virus negli organi linfatici– risposta immunitaria HIV-specifica (1 settimana-tre mesi) Riduzione replicazione virale + comparsa risposta immunitaria
2a fase • Latenza clinica • 8-12 anni;graduale deterioramento del sistema immunitario – replicazione attiva nei linfonodi – diminuzione dei linfociti T CD4+ • … 3a fase
3a fase • Fase sintomatica: • sintomi iniziali modesti (perdita di peso, astenia); replicazione virale nel sangue e nei linfonodi - T CD4+ < 200/l • comparsa di infezioni opportunistiche
Trasmissione • per via parenteralecon emotrasfusioni ed emoderivati; • attraverso lo scambio di siringhe; • per contatto accidentale con aghi o strumenti contaminati • per via sessuale: omo ed eterosessuale • per via verticale: durante la gravidanza, al momento • del parto, dopo la nascita, con l’allattamento.
Rischio di trasmissione attraverso le trasfusioni > 90% (ma eliminato) per omosessuali e tossicodipendenti: 15-70% rapporti eterosessuali: 1% trasmissione verticale: Africa 35%; Europa 14% esposizione occasionale da parte di personale addetto all’assistenza di pazienti HIV+: 0,3%
Tre modelli epidemiologici Modello 1:maggior parte dei casi in omosessuali (70%) e tossicodipendenti (15-20%) Paesi: Nord America, Europa occidentale, …; incidenza maggiore nei maschi (85%); età: 15-49 anni. Eccezione: paesi area mediterranea (Italia , Spagna) 2/3 dei casi in tossicodipendenti; 5% in eterosessuali; maggior numero di casi di AIDS pediatrico. Modello 2: soprattutto casi da contagio eterosessuale; alta prevalenza di infetti nella popolazione generale (fino al 36% nella classe di età 15-49 anni). Paesi: Africa subsahariana; Caraibi; Sud-Est asiatico. Modello 3: paesi a bassa prevalenza. Paesi: Est Europa, Isole del Pacifico, …
EPIDEMIOLOGIA QUALCHE DATO SULLE DIMENSIONI DEL PROBLEMA
Estimated number of people living with HIV globally, 1990–2007 40 Millions 30 Number of people living with HIV 20 10 0 1990 1991 1992 1993 1994 1995 1996 1997 1998 1999 2000 2001 2002 2003 2004 2005 2006 2007 Year This bar indicates the range 1
Estimated number of people newly infected with HIV globally, 1990–2007 Upper range Estimate 6 Millions Lower range 5 Number of people newly infected with HIV 4 3 2 1 0 1990 1991 1992 1993 1994 1995 1996 1997 1998 1999 2000 2001 2002 2003 2004 2005 2006 2007 Year 4
Eastern Europe & Central Asia 1.6 million [1.2 – 2.1 million] Western & Central Europe 760 000 [600 000 – 1.1 million] North America 1.3 million [480 000 – 1.9 million] East Asia 800 000 [620 000 – 960 000] Middle East&North Africa 380 000 [270 000 – 500 000] Caribbean 230 000 [210 000 – 270 000] South & South-East Asia 4.0 million [3.3 – 5.1 million] Sub-Saharan Africa 22.5 million [20.9 – 24.3 million] Latin America 1.6 million [1.4 – 1.9 million] Oceania 75 000 [53 000 – 120 000] Adults and children estimated to be living with HIV 2007 Total: 33.2 (30.6 – 36.1) million
Eastern Europe & Central Asia 150 000 [70 000 – 290 000] Western & Central Europe 31 000 [19 000 – 86 000] North America 46 000 [38 000 – 68 000] East Asia 92 000 [21 000 – 220 000] Middle East&North Africa 35 000 [16 000 – 65 000] Caribbean 17 000 [15 000 – 23 000] South & South-East Asia 340 000 [180 000 – 740 000] Sub-Saharan Africa 1.7 million [1.4 – 2.4 million] Latin America 100 000 [47 000 – 220 000] Oceania 14 000 [11 000 – 26 000] Estimated number of adults and children newly infected with HIV, 2007 Total: 2.5 (1.8 – 4.1) million
Eastern Europe & Central Asia 55 000 [42 000 – 88 000] Western & Central Europe 12 000 [<15 000] North America 21 000 [18 000 – 31 000] East Asia 32 000 [28 000 – 49 000] Middle East&North Africa 25 000 [20 000 – 34 000] Caribbean 11 000 [9800 – 18 000] South & South-East Asia 270 000 [230 000 – 380 000] Sub-Saharan Africa 1.6 million [1.5 – 2.0 million] Latin America 58 000 [49 000 – 91 000] Oceania 1200 [<500 – 2700] Estimated adult and child deaths from AIDS, 2007 Total: 2.1 (1.9 – 2.4) million
Eastern Europe & Central Asia 3500 [2200 – 6400] Western & Central Europe <1000 [630 – 3100] North America 1600 [<1000] East Asia 2100 [<1000 – 2100] Middle East&North Africa 5500 [3800 – 8200] Caribbean 2000 [1800 – 3400] South & South-East Asia 24 000 [14 000 – 31 000] Sub-Saharan Africa 370 000 [320 000 – 470 000] Latin America 6700 [5500 – 12 000] Oceania <1000 [<1000 – 1400] Estimated number of children (<15 years) newly infected with HIV, 2007 Total: 420 000 (350 000 – 540 000)
Eastern Europe & Central Asia 12 000 [8700 – 15 000] Western & Central Europe 3000 [2400 – 12 000] North America 11 000 [4500 – 20 000] East Asia 9100 [2400 – 12 000] Middle East&North Africa 28 000 [19 000 – 32 000] Caribbean 10 000 [8300 – 16 000] South & South-East Asia 120 000 [71 000 – 130 000] Sub-Saharan Africa 2.2 million [2.0 – 2.3 million] Latin America 39 000 [33 000 – 51 000] Oceania 1400 [1100 – 2800] Children (<15 years) estimated to be living with HIV 2007 Total: 2.5 (2.2 – 2.6) million
Eastern Europe & Central Asia 1900 [1600 – 3000] Western & Central Europe <1000 [<1000 – 2600] North America <1000 [<100 – 1300] East Asia 1300 [<1000 – 1400] Middle East&North Africa 4200 [3700 – 6100] Caribbean 1500 [1300 – 5700] South & South-East Asia 17 000 [12 000 – 20 000] Sub-Saharan Africa 290 000 [280 000 – 340 000] Latin America 4900 [4500 – 7100] Oceania <500 [<500 – 1400] Estimated deaths in children (<15 years) from AIDS 2007 Total: 330 000 (310 000 – 380 000)
Over 6800 new HIV infections a day in 2007 • More than 96% are in low and middle income countries • About 1200 are in children under 15 years of age • About 5800 are in adults aged 15 years and older • of whom: • almost 50% are among women • about 40% are among young people (15-24)
2007 global HIV and AIDS estimates Children (<15 years) • Children living with HIV2.5 million[2.2 – 2.6 million] • New HIV infections in 2007420 000[350 000 – 540 000] • Deaths due to AIDS in 2007330 000 [310 000 – 380 000]
Sub-Saharan Africa Middle East & North Africa South and South-East Asia East Asia Latin America Caribbean Eastern Europe & Central Asia Western & Central Europe North America Oceania TOTAL Regional HIV and AIDS statistics and features, 2007 Adults & children living with HIV Adults & children newly infected with HIV Adult prevalence (15‒49) [%] Adult & child deaths due to AIDS 22.5 million [20.9 – 24.3 million] 1.7 million [1.4 – 2.4 million] 5.0% [4.6% – 5.5%] 1.6 million [1.5 – 2.0 million] 380 000 [270 000 – 500 000] 35 000 [16 000 – 65 000] 0.3% [0.2% – 0.4%] 25 000 [20 000 – 34 000] 4.0 million [3.3 – 5.1 million] 340 000 [180 000 – 740 000] 0.3% [0.2% – 0.4%] 270 000 [230 000 – 380 000] 800 000 [620 000 – 960 000] 92 000 [21 000 – 220 000] 0.1% [<0.2%] 32 000 [28 000 – 49 000] 1.6 million [1.4 – 1.9 million] 100 000 [47 000 – 220 000] 0.5% [0.4% – 0.6%] 58 000 [49 000 – 91 000] 230 000 [210 000 – 270 000] 17 000 [15 000 – 23 000] 1.0% [0.9% – 1.2%] 11 000 [9800 – 18 000] 1.6 million [1.2 – 2.1 million] 150 000 [70 000 – 290 000] 0.9% [0.7% – 1.2%] 55 000 [42 000 – 88 000] 12 000 [<15 000] 760 000 [600 000 – 1.1 million] 31 000 [19 000 – 86 000] 0.3% [0.2% – 0.4%] 1.3 million [480 000 – 1.9 million] 46 000 [38 00 – 68 000] 0.6% [0.5% – 0.9%] 21 000 [18 000 – 31 000] 75 000 [53 000 – 120 000] 14 000 [ 11 000 – 26 000] 0.4% [0.3% – 0.7%] 1200 [<500 – 2700] 33.2 million [30.6 – 36.1 million] 2.5 million[1.8 – 4.1 million] 0.8% [0.7% - 0.9%] 2.1 million [1.9 – 2.4 million] The ranges around the estimates in this table define the boundaries within which the actual numbers lie, based on the best available information.
Prevenzione • Esclusione dei donatori con comportamenti a rischio • Controllo unità di sangue e trattamento termico degli emoderivati • Iniziative di carattere informativo/educativo sui soggetti con comportamenti a rischio: difficile valutazione • Allestimento di vaccini: sperimentazioni in corso, ma ancora in fasi iniziali • Precauzioni “universali” per operatori sanitari
sistema di sorveglianza europeo (EURO-HIV) “In Western Europe, thousands of new infections are occurring every year and large numbers of HIV-infected persons are unaware of their HIV status. A large share of new HIV diagnoses are in people originating fromcountries with serious epidemics.”