Download
1 / 25
250 likes | 428 Views
Putnam County Transportation 2019 Report. July 23, 2019 Putnam County Department of Planning, Development & Public Transportation. Outline. MV Contract & Modern Fleet PART Fixed Route Croton Falls Shuttle Cold Spring Trolley Putnam Valley Shuttle Paratransit Ridership Trends

E N D
Putnam County Transportation2019 Report July 23, 2019 Putnam County Department of Planning, Development & Public Transportation
Outline • MV Contract & Modern Fleet • PART Fixed Route • Croton Falls Shuttle • Cold Spring Trolley • Putnam Valley Shuttle • Paratransit • Ridership Trends • Total Cost, Ridership & Cost/Ride 2012 – 2019 • Pre-K & E.I.E. • Veterans Transportation – OSR RSVP Program • Mobility Management • Questions
MV Transportation • In April, the contract with MV was extended to March 31, 2020. • As of January 2019, with purchase of new paratransit vehicles, Putnam County’s Transportation Fleet is modern and up to date and right-sized. • All of our fixed route buses and Paratransit vehicles are handicap accessible and 2017 or newer. (8 from 2017, 4 from 2018 and 4 from 2019)
Fixed Route Flexibility • PART’s fixed routes have shown that the On Call system (where riders can call in pickups to certain locations that are off the fixed route but serves a ridership in need) is a successful way to increase access in a mainly rural county. • In recent years On Calls have been added including but not limited to several senior citizen housing developments, shopping plazas in Brewster and Patterson, and in the densely populated Lake Carmel area. • PART also enables connections outside of Putnam with transfers to Westchester and Connecticut’s HART service and of course Metro North Train Stations making PART a component of a greater regional network.
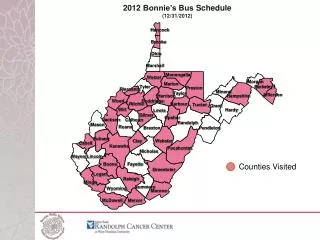
Croton Falls Shuttle • Partnerships with Metro North Railroad, MTA since 2016.
Cold Spring Trolley • Partnerships with Putnam County Visitors Bureau, Cold Spring Chamber of Commerce and private stakeholders (Magazzino, Boscobel, Manitoga, etc.)
Putnam valley shuttle • Discontinued in February 2019.
ADA Paratransit in recent years 2017 Paratransit Cost = $400,012 Paratransit Cost/Ride = $24.30 Paratransit Rides = 16,463 Eligible Riders = 471 Active Riders = 210 2018 Paratransit Cost = $410,851 Paratransit Cost/Ride = $27.21 Paratransit Rides = 15,100 Eligible Riders = 452 Active Riders = 212
ADA Paratransit Applications *As of 7/15/2019
Transit Total ridership Public Transportation has been on a nationwide trend downwards in the last decade (NTD). Chart Taken From: “Understanding the Recent Transit Ridership Decline in Major US Cities: Service Cuts or Emerging Modes?” ttp://usa.streetsblog.org/wp-content/uploads/sites/5/2019/01/19-04931-Transit-Trends.pdf
Transit Total ridership 2018 Was the Year of the Car, and Transit Ridership Felt It “Buses — still the workhorses of public transportation in most cities — have seen some of the steepest declines in ridership over the years. Since 2013, ridership has fallen 14.3 percent nationwide, according to APTA [American Public Transportation Association] statistics. The quality of the bus service — measured by factors like frequency, on-time arrivals and overall experience — is often a significant factor influencing ridership.” https://www.govtech.com/fs/transportation/2018-Was-the-Year-of-the-Car-and-Transit-Ridership-Felt-It.html
PRE-K/E.I.E. Drop offs at schools in the following towns: Brewster Mahopac Yorktown Granite Springs Beacon Wappingers Cornwall on Hudson Briarcliff Manor White Plains Valhalla From Sept 2018 thru June 2019 16 AM runs 6 Midday runs 17 PM runs From June 2019-Aug 2019 16 AM runs 6 Midday runs 18 PM runs
Veterans Transportation – OSR and RSVP Program • Cost Breakdown • 2018: $5,000 • 2017: $5,000 • 2016: $44,000 • 1411 Rides in the last 3 years, 75 Veterans serviced. • Ridership Breakdown • 2018: 381 rides given to 37 Veterans • 2017: 528 rides given to 40 Veterans • 2016: 502 rides given to 44 Veterans
Mobility Management • Revamped website and information resources. • https://www.putnamcountyny.com/transportation/ • https://pcny.maps.arcgis.com/apps/webappviewer/index.html?id=941492ad4823465aa1c29d1365468b4c • 1 call center. Comprehensive guide to transit options in the county, work with neighboring municipalities to transfer riders, provide info • Travel training in person or over the phone i.e. first mile/last mile alternatives and eventual connection to Putnam Transit • Scheduling flexibility with on calls/constant feedback loop between Mobility Manager and Transportation Manager, MV