Financial Statements Analysis
Financial Statements Analysis. Investing versus Speculating. Stock investors own a small part of the companies they hold. Business ownership In the long run, the stock will perform as well (or as poorly) as the underlying business. Speculating

Financial Statements Analysis
E N D
Presentation Transcript
Investing versus Speculating • Stock investors own a small part of the companies they hold. • Business ownership • In the long run, the stock will perform as well (or as poorly) as the underlying business. • Speculating • Expectation of short-term trading profits from share-price fluctuations. • Underlying business is irrelevant • So investors need to know about the underlying business!
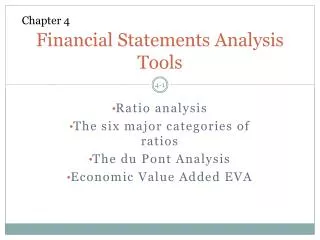
Ratio analysis: Why are ratios useful? • Ratios standardize numbers and facilitate comparisons • Ratios are used to highlight weaknesses and strengths. • Ratio comparisons should be made through time and with competitors. • Trend analysis. • Peer (or industry) analysis.
What are the five major categories of ratios, and what questions do they answer? • Liquidity: Can we make required payments? • Asset management: right amount of assets vs. sales? • Debt management: Right mix of debt and equity? • Profitability: Do sales prices exceed unit costs, and are sales high enough as reflected in PM, ROE, and ROA? • Market value: Do investors like what they see as reflected in P/E and M/B ratios?
2009E 85,632 878,000 1,716,480 2,680,112 1,197,160 380,120 817,040 3,497,152 2008 7,282 632,160 1,287,360 1,926,802 1,202,950 263,160 939,790 2,866,592 D’Leon’s Balance Sheet: Assets Cash A/R Inventories Total CA Gross FA Less: Dep. Net FA Total Assets
D’Leon’s Balance sheet: Liabilities and Equity Accts payable Notes payable Accruals Total CL Long-term debt Common stock Retained earnings Total Equity Total L & E 2009E 436,800 300,000 408,000 1,144,800 400,000 1,721,176 231,176 1,952,352 3,497,152 2008 524,160 636,808 489,600 1,650,568 723,432 460,000 32,592 492,592 2,866,592
D’Leon’s Income statement Sales COGS Other expenses EBITDA Depr. & Amort. EBIT Interest Exp. EBT Taxes Net income 2009E 7,035,600 5,875,992 550,000 609,608 116,960 492,648 70,008 422,640 169,056 253,584 2008 6,034,000 5,528,000 519,988 (13,988) 116,960 (130,948) 136,012 (266,960) (106,784) (160,176)
2009E 250,000 $1.014 $0.220 $12.17 2008 100,000 -$1.602 $0.110 $2.25 Other data No. of shares EPS DPS Stock price
Calculate D’Leon’s forecasted current ratio for 2009. Current ratio = Current assets / Current liabilities = • Expected to improve but still below the industry average. • Liquidity position is weak. See also the Quick ratio in text
What is the inventory turnover vs. the industry average? Inv. turnover = Cost of Sales / Inventories = Inventory turnover is below industry average. D’Leon might have old inventory, or its control might be poor.
Calculate the debt ratio and EBIT coverage ratios. Debt to equity = long-term debt/ equity = Debt to total capital = Long term debt debt / (equity +long term debt) = Interest coverage = EBIT / Debt Interest charge =
How do the debt management ratios compare with industry averages?
Profitability ratios: Profit margin Profit margin = Net income / Sales = Profit margin was very bad in 2008, but is projected to exceed the industry average in 2003. .
Profitability ratios: Return on assets and Return on equity ROA = Net income / Total assets = ROE = Net income / Total common equity = • Both ratios rebounded from the previous year, but are still below the industry average. More improvement is needed. • Wide variations in ROE illustrate the effect that leverage can have on profitability.
Calculate the Price/Earnings and Market/Book ratios P/E = Price / Earnings per share = M/B = Mkt price per share / Book value per share =(Book value is Total Assets minus Total Liabilities)
Analyzing the market value ratios • P/E: How much investors are willing to pay for $1 of earnings. • M/B: How much investors are willing to pay for $1 of book value equity. • For each ratio, the higher the number, the better. • P/E and M/B are high if ROE is high and risk is low.
Extended DuPont equation: Breaking down Return on equity ROE = (Profit margin) x (TA turnover) x (Equity multiplier) = 3.6% x 2 x 1.8 = 13.0%
The Du Pont system Also can be expressed as: ROE = (NI/Sales) x (Sales/TA) x (TA/Equity) • Focuses on: • Expense control (PM) • Asset utilization (TATO) • Debt utilization (Eq. Mult.) • Shows how these factors combine to determine ROE.
Potential problems and limitations of financial ratio analysis • Comparison with industry averages is difficult for a conglomerate firm that operates in many different divisions. • “Average” performance is not necessarily good, perhaps the firm should aim higher. • Seasonal factors can distort ratios. • “Window dressing” techniques can make statements and ratios look better. • Different operating and accounting practices can distort comparisons. • Sometimes it is hard to tell if a ratio is “good” or “bad”. • Difficult to tell whether a company is, on balance, in strong or weak position.
Can Financial Statements Be Trusted? • Accounting scandals • Accounting restatements • Changing the numbers…
Learning objectives Discuss about the stock market investment versus stock market speculation Know to calculate all the financial ratios that are on the slides. Know to interpret the financial ratios, based on the textbook Know the calculations and interpretation of the DuPont formula Discuss the problems relying on the financial statements, based on p.310-311 text End of chapter questions 10.1 to 10.4, CFA problems 10.1 to 10.4 Midterm exam type questions