Download
1 / 22
220 likes | 341 Views
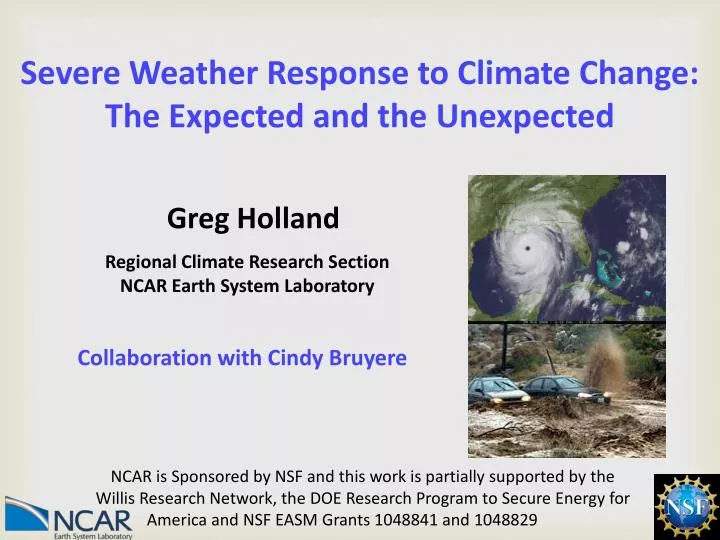
Severe Weather Response to Climate Change: The Expected and the Unexpected. Greg Holland. Regional Climate Research Section NCAR Earth System Laboratory. Collaboration with Cindy Bruyere. NCAR is Sponsored by NSF and this work is partially supported by the

E N D
Severe Weather Response to Climate Change: The Expected and the Unexpected Greg Holland Regional Climate Research Section NCAR Earth System Laboratory Collaboration with Cindy Bruyere NCAR is Sponsored by NSF and this work is partially supported by the Willis Research Network, the DOE Research Program to Secure Energy for America and NSF EASM Grants 1048841 and 1048829
Summary • IPCC assessment of extremes and climate change • Application of EVT to hurricane extremes • The Anthropogenic Climate Change Index (ACCI) • Past changes in hurricane extremes, expected and unexpected. Holland, ETH October 2012
IPCC Findings “There is evidence that some extremes have changed as a result of anthropogenic influences, including increases in atmospheric concentrations of greenhouse gases.” • likely for extreme maximum temperatures • medium for extreme precipitation • likely for extreme coastal high water • Likely increase in tropical cyclone maximum winds (IPCC SREX 2012) Holland, ETH October 2012
Sensitivity of Extremes (IPCC SREX 2012) Holland, ETH October 2012
Quantifiable Through Extreme Value Theory We utilize the Weibull distribution for which the PDF and Exceedence Probability are: Where parameters a and b determine the scale and the shape, respectively. Holland, ETH October 2012
Sensitivity of Extremes The Weibull distribution mean and variance are given by: • For Atlantic tropical cyclones: • Changes to the mean and standard deviation of 2.5-3 ms-1 (around the observational resolution) results in: • 100-150% increase in Cat 4-5 and • 200-300% increase in Cat 5. (Holland and Bruyere 2012) Holland, ETH October 2012
An Example: Melbourne Australia Temperatures Maximum Temperatures http://ckrao.files.wordpress.com/2011/12/spring-in-melbourne1.jpg Holland, ETH October 2012
Assessing Extremes from Low-Resolution Models Projected increase in TC intensity, but model can only resolve up to Cat 2. Wind speed distribution shifting to right Holland, ETH October 2012
Future Hurricane Extremes Very similar results from using GPD instead of Weibull (Holland and Suzuki 2012) Holland, ETH October 2012
A Conundrum Intense Hurricanes Likely to Increase with Global Warming (IPCC, WMO) That Global Warming has Already Occurred is Unequivocal (IPCC) No Evidence for Current Hurricane Changes?(IPCC WMO) Holland, ETH October 2012
Weather Impacts Have Increased Is there a Weather Signal? “Global weather-related losses in recent years have been trending upward much faster than population, inflation, or insurance penetration, and faster than non–weather-related events.” (Mills, 2005 Science) Holland, ETH October 2012
The Anthropogenic Climate Change IndexACCI Meehl et al 2004, IPCC AR4 Temp erature Anomaly (oC) (Data from Julie Arblaster 2009) Holland, ETH October 2012
Tropical Cyclone Data Used • IBTraCS data without change (10 min mean), except in western North Pacific where JTWC data set is used. • Bin all hurricanes into the Saffir-Simpson category ranges (Simpson and Riehl 1981). • 5-y smoothed annual time series to remove ENSO type variability; p-values are calculated from the raw annual data to ensure no serial correlation. • In addition: • Recently upgraded satellite data set and automated analysis from Kossin (pers comm 2012), • Hurricane landfall data: our own (0.5 degree land proximity), and from Weinkle et al (2012), and • Dynamical downscaling results of Bender et al (2008), Holland and Suzuki-Parker (2012), and Wu and Zhao (2011). Holland, ETH October 2012
Tropical Cyclone Response to Global Warming (Holland and Bruyere 2012) • SH Cyclones are in year season commenced Holland, ETH October 2012
Intense Hurricane Response Change/oC Global -30% 40% (Holland and Bruyere 2012) (Holland and Webster 2007) (Elsner et al 2009) Holland, ETH October 2012
Regional Intense Hurricane Changes Holland and Bruyere (2012) Holland, ETH October 2012
Summary of Available Studies (Observed) Changing proportion of hurricanes found by the indicated studies. (Holland and Bruyere 2012) Holland, ETH October 2012
Weather Extremes Provide a Bellwether of Climate Variability and Change Holland, ETH October 2012
Differing Study Results:Same Answer! (North Atlantic) (Holland and Bruyere 2012) Working Hypothesis: Weather extremes initially respond strongly to climate change, then reach a saturation level beyond which further climate change has little effect. Holland, ETH October 2012
Note that Weather Extremes are Bounded (Holland and Bruyere 2012) Holland, ETH October 2012
Character of the Observed Tropical Cyclone Changes (Holland and Bruyere 2012) Proportion is relative to all hurricanes Holland, ETH October 2012
Summary • Extreme weather provides a bellwether of climate variability and change • Global anthropogenic warming arguably commenced around 1960-1970 • Intense hurricanes have responded strongly to this warming with development of a bimodal distribution • Intense hurricane (weather) changes may reach a saturation beyond which there is no further anthropogenic signal Holland, ETH October 2012