Download
1 / 19
190 likes | 199 Views
This report by Adam Sieminski, Administrator of the American Petroleum Institute, provides insights into the growth of shale gas and tight oil production in the U.S. It discusses the decline curves of shale gas wells, the growth of natural gas consumption in transportation, and the future potential for the U.S. to become a net exporter of natural gas.

E N D
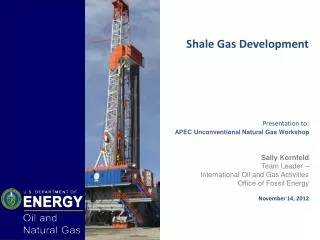
Outlook for shale gas and tight oil development in the U.S. For American Petroleum Institute April 04, 2013 | Washington, DC By Adam Sieminski, Administrator
U.S. Shale Gas Adam Sieminski , API, April 04, 2013
An average well in shale gas and other continuous resource plays can also have steep decline curves, which require continued drilling to grow production million cubic feet per year Source: EIA, Annual Energy Outlook 2012 1 Adam Sieminski , API, April 04, 2013
For example: Oil production by monthly vintage of wells in the Williston Basin Source: DrillingInfo history through August 2012, EIA Short-Term Energy Outlook, February 2013 forecast Adam Sieminski , API, April 04, 2013
Domestic production of shale gas has grown dramatically over the past few years shale gas production (dry) billion cubic feet per day Sources: LCI Energy Insight gross withdrawal estimates as of January 2013 and converted to dry production estimates with EIA-calculated average gross-to-dry shrinkage factors by state and/or shale play. Adam Sieminski , API, April 04, 2013
Shale gas leads growth in total gas production through 2040 U.S. dry natural gas production trillion cubic feet Source: EIA, Annual Energy Outlook 2013 Early Release History Projections 2011 Shale gas Tight gas Non-associated offshore Alaska Coalbed methane Associated with oil Non-associated onshore Adam Sieminski , API, April 04, 2013
Natural gas consumption is quite dispersed with electric power, industrial, and transportation use driving future demand growth U.S. dry gas consumption trillion cubic feet Source: EIA, Annual Energy Outlook 2013 Early Release History Projections *Includes combined heat-and-power and lease and plant fuel. **Includes pipeline fuel. Electric power 32% 31% Industrial 33% 33% 2% Gas to liquids 6% 3% Transportation 13% 12% Commercial 19% 14% Residential Adam Sieminski , API, April 04, 2013
Growth of natural gas in transportation led by heavy duty trucks (LNG) and gas to liquids (diesel)… marine and rail to come? U.S. natural gas consumption quadrillion Btu Note: Gas to liquids includes heat, power, and losses. Source: EIA, Annual Energy Outlook 2013 Early Release History Projections 2011 28% Gas to liquids Freight trucks 38% 1% 3% Buses 1% 1% Light-duty vehicles 3% Pipeline fuel 31% 95% Adam Sieminski , API, April 04, 2013
The U.S. is projected to be both an exporter and importer of natural gas U.S. natural gas imports and exports trillion cubic feet Source: EIA, Annual Energy Outlook 2013 Early Release Exports to Mexico Exports to Canada Lower 48 LNG exports Alaska LNG exports Imports from Canada LNG imports Adam Sieminski , API, April 04, 2013
Domestic natural gas production grows faster than consumption and the U.S. becomes a net exporter of natural gas around 2020 U.S. dry gas trillion cubic feet Source: EIA, Annual Energy Outlook 2013 Early Release 2011 History Projections Consumption Domestic supply Net imports Adam Sieminski , API, April 04, 2013
U.S. Tight Oil Adam Sieminski , API, April 04, 2013
Domestic production of tight oil has grown dramatically over the past few years tight oil production for select plays million barrels per day Source: Drilling Info (formerly HPDI), Texas RRC, North Dakota department of mineral resources, and EIA, through October 2012. Adam Sieminski , API, April 04, 2013
U.S. tight oil production leads a growth in domestic production of 2.6 million barrels per day between 2008 and 2019 U.S. crude oil production million barrels per day Source: EIA, Annual Energy Outlook 2013 Early Release and Short-Term Energy Outlook, March 2013 2011 History Projections STEO March 2013 U.S. crude oil projection Tight oil Other lower 48 onshore Lower 48 offshore Alaska Adam Sieminski , API, April 04, 2013
U.S. petroleum product exports exceeded imports in 2011 for first time in over six decades annual U.S. net exports of total petroleum products, 1949 – 2011 million barrels per day Source: EIA, Petroleum Supply Monthly net product exporter Adam Sieminski , API, April 04, 2013
U.S. dependence on imported liquids depends on both supply and demand U.S. liquid fuel supply million barrels per day Source: EIA, Annual Energy Outlook 2013 Early Release and Short-Term Energy Outlook, March 2013 History Projections 2014 2012 Consumption 32% STEO forecast for 2014 37% 40% Net imports Domestic supply Adam Sieminski , API, April 04, 2013
Light-duty vehicle liquids consumption is lower primarily due to more stringent CAFE standards light-duty vehicle liquids consumption million barrels per day Source: EIA, Annual Energy Outlook 2013 Early Release AEO2012 AEO2013 Adam Sieminski , API, April 04, 2013
Global tight oil production comparisons IEO2013 DRAFT BP Energy Outlook 2030 million barrels per day Source: Preliminary International Energy Outlook 2013, BP Energy Outlook 2030 Adam Sieminski , API, April 04, 2013
Increasing demand for current market analysis from EIA • Gas markets – LNG exports and impact on domestic prices over time • Oil and gas production data (federal lands vs. rest), forecasts, and reserves • Crude and product markets, refining and midstream changes • Types of refining capacity in different regions (crude preferences) • Rail transportation • Jones Act tanker availability • Refinery availability and outage analysis including regional price impacts • Exports of refined products and impact on domestic prices • Disposition of increased domestic tight light crude production • Renewable Fuels Standard / RINS / cellulosic ethanol • Growth of natural gas use in transportation • International disruptions and ongoing sanctions-related analyses Adam Sieminski , API, April 04, 2013
For more information U.S. Energy Information Administration home page | www.eia.gov Annual Energy Outlook | www.eia.gov/forecasts/aeo Short-Term Energy Outlook | www.eia.gov/forecasts/steo International Energy Outlook | www.eia.gov/forecasts/ieo Today In Energy | www.eia.gov/todayinenergy Monthly Energy Review | www.eia.gov/totalenergy/data/monthly Annual Energy Review | www.eia.gov/totalenergy/data/annual Adam Sieminski , API, April 04, 2013