Download
1 / 74
740 likes | 758 Views
This article discusses the importance of measuring genuine progress in agriculture and highlights the GPI Soils & Agriculture Accounts as a comprehensive tool for assessing economic viability, resource capacity, and social capital in the agricultural sector.

E N D
Genuine Progress Index for Atlantic CanadaIndice de progrès véritable - AtlantiqueMeasuring Genuine Progress in Agriculture: The GPI Soils and Agriculture AccountsInn on the Lake, Nova Scotia, January 23, 2003
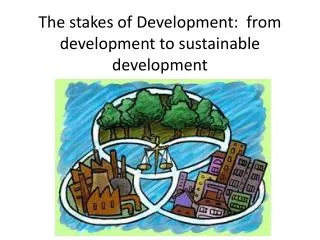
Sustainable Development orWhat kind of world are we leaving to our children? Less fish in the oceans? Fewer old forests? Depleted soils? Fewer species of animals and plants? A poorer natural world? A dangerously warming world? Is this progress?
Are we Sending the Wrong Message? GDP and Natural Capital • GDP counts resource depletion as economic gain: the more trees we cut, the more fish we sell, the faster we deplete our natural wealth— the more the economy will grow. • The more we consume, drive our cars, turn up our thermostats, burn fossil fuels and waste energy, the more the economy will grow and the “better off” we think we are.
“The more the economy grows, the better off we are” - Sending the wrong message?
Why We Need New Indicators • GDP makes no distinction as to what is growing. Crime, pollution, climate change damage costs (e.g. storm cleanup,), make the economy grow—just because money is being spent. • GDP gives no value to voluntary work, unpaid household work, free time, equity. Economy can grow even as poverty, inequality grow
Why We Need New Indicators • Misusing economic growth measures to assess prosperity & well-being sends misleading signals to policy-makers: “More” is “better.” • And so, initiatives to conserve and use resources sustainably and to reduce greenhouse gas emissions are blunted. • Indicators are powerful: Reflect our values, determine policy agenda, influence behaviour (e.g. students)
GPIAtlantic founded 1997 • Independent non-profit research group • Mandate: Create better measures of progress • Nova Scotia pilot project for Canada, working closely with Statistics Canada • Can provide more accurate and comprehensive measures of wellness that demonstrate cost-effectiveness of prevention
Measuring Genuine Progress: The GPI • Natural resources seen as capital assets subject to depreciation and requiring re-investment. • Pollution clean up and climate change adaptation costs are counted as "defensive expenditures" rather than net contributions to wellbeing. • Reductions in GHG emissions, pollution, ecological footprint, inequality, crime are signs of genuine progress that makes the index rise. (Cf GDP) "less" can be "better" in the GPI.
GPI has 22 Components: • Natural Resource Accounts (forests, fish, soils, water, energy) • Measures of Environmental Quality (air, GHG emissions, solid waste, footprint, transportation) • Time Use (paid + unpaid work, free time) • Social Capital (health, education, income distribution, livelihood security, crime, debt)
Valuing Natural Capital For example, forest functions / values include: • Preventing soil erosion/sediment control • Protecting watersheds • Climate regulation/carbon sequestration • Providing habitat for wildlife / biodiversity • Recreation, tourism, aesthetic quality • Providing timber
Provincial Area (hectares) of Clearcut Harvest and Silviculture (000’s seedlings), Nova Scotia 1975-1997
Old Forests Store More Carbon A new study published in Science, reported that: ... replacing old-growth forest by young Kyoto stands ... will lead to massive carbon losses to the atmosphere mainly by replacing a large pool with a minute pool of regrowth and by reducing the flux into a permanent pool of soil organic matter. (Schulze et. al. 2000)
Recreational Brook Trout Caught and Retained in Nova Scotia 1975-1995
Genuine Progress in AgricultureHow do we measure it?Are we achieving it?January 23, 2003 Ronald Colman PhD
GPI Atlantic Agriculture Accounts 3 sections: • Economic Viability(completed 2001) • Resource Capacity & Use(complete March 2003) • Social Capital(complete March 2005)
We want to answer the following questions: • How do we measure genuine progress in agriculture? • Are we making genuine progress in agriculture (do we know?)? • If yes, celebrate and highlight positive change. • If not, how do we achieve progress?
Small sample of work to date Examples from 1st three volumes • Economic Viability • Resource Capacity & Use: Soil Quality; Biodiversity Full reports at www.gpiatlantic.org
Economic Viability~ Indicators ~ • Net farm income • Expense to income ratio (%) • Return on investment (%) • Debt to net income ratio (%) • Direct payments to producers and dependency ratio (%)
Although total farm cash receipts 12% (1971-1999)... Net Farm income declined by 46% Expense to income ratio increased from 83 to 90% Debt to net income ratio increased from 300 to 900% Dependency ratio increased from 15 to 35% Economic Viability: NS Results
Resource Capacity & Use • Soil • Water • Input Use Efficiency • Livestock • Biodiversity
Soil Quality and Productivity ~ Comments ~ “I feel very personal about all of our land. I want to build it up in quality. Luckily this isn’t too hard since it was mostly forage and orchard…” -Kings County mixed farmer.
Soil Quality and Productivity ~ Comments ~ “…Erosion is the difficult thing. The problem is there isn’t much animal agriculture in the Valley anymore and not much money in hay. We could have a rotation of sod, but in the Valley the climate lends itself to vegetable production. Really we need [ruminant] animals for hay rotation and manure.” - Kings County poultry and vegetable producer.
Soil Quality and Productivity~ Comments ~ “… We struggle to do the right things…. We have a responsibility to maintain our agricultural and land resources. The burden on farmers is unfair.”-Kings County vegetable farmer.
Soil Quality and Productivity ~ Comments ~ “Valley farms are losing the livestock sector and I’m concerned about the need for diversity. It would be ideal to turn the soil back into sod for two to three years [between annual crops], and crop rotation is really important. The reason I pay attention to soil organic matter was the soil erosion and yield losses I saw with continuous potatoes… the soil around Canning has been really depleted over time.” -Kings County pork, grain, & beef farmer.
Soil Quality and Productivity ~ Indicators ~ • Soil Organic Carbon • Soil Structure • Soil Erosion/Conservation • Soil Foodweb Health
There are a number of ways to measure soil organic carbon… % SOC or t SOC/ha Return of residues and manure to soil Portion of rotation land in soil-building crops (perennial forage) Average annual losses of 23 kg/ha Eastern Canada Provincial data not available 80% for NS Soil Organic Carbon: Results
Nova Scotia has a high proportion of rotation land in potentially soil-building crops.Although we don’t know to what degree potentially soil-degrading crops are rotated with potentially soil-building crops...
Prevalence (%) of potentially Building, Neutral, or Degrading Crops on Rotation Land, 2001
STOCK N content of soil organic carbon in agricultural crop land: $945 million FLOW Average N & P fertilizer replacement value contributed by soil organic carbon: $17 million annually or $102/ha annually The Value of Soil Organic Carbon -NS
Soil Organic Carbon -*Avoidance Value* Maintaining SOC (5.8 t C/ha annual soil addition) Examples: • $70/ha annual investment required, due to income lost in implementing a corn/forage rotation OR • $288/ha annual net benefit for spreading beef manure
Soil Organic Carbon -*Restoration Value* • Replacing SOC lost by continuous vegetable cropping (5.8 t C/ha) by annual addition of purchased compost to the soil: $682/ha annually
Conclusion: Preventing soil organic carbon loss makes sense • Prevent loss of SOC (avoidance value): • Add manure ($288/ha annual net benefit) • Rotate with forages ($70/ha annual net investment) • Replace SOC after it is gone (restoration value): • Purchase compost ($682/ha annual cost)
Water Quality and Capacity ~ Indicators ~ • Availability of water for farm use • Ground water quality • Surface water quality
Availability of Water for Farm Use • Levels of precipitation are down, and in some cases, a severe water shortage (more than 40% below norm) has occurred • The number of farms using irrigation and the area of irrigation has increased dramatically (560% increase in Kings County, 477% increase in NS)
Availability of water for farm useProposed precipitation thresholds
Total Precipitation May 1-Sept 1 1997-2000Severe shortage 3 yrs Kentville, 1 yr Nappan
Input Use Efficiency~ Indicators ~ • Nutrient use efficiency • Pesticide use efficiency • Energy use efficiency • Greenhouse gas emissions
N Fertilizer Use and Cash Receipts ($1997) per ha of Cropland, Nova Scotia Farms, 1971-1991
Ratio of N Fertilizer Use to Farm Cash Receipts, Nova Scotia
The ratio of N use to farm cash receipts is going up We need more recent N use data to track this trend!
Pesticide Expenditure and Cash Receipts per ha of Nova Scotia Cropland , 1971-1996 ($1997)
Ratio of Pesticide Expenditure to Farm Cash Receipts, Nova Scotia
Pesticide expenditures are rising relative to farm cash receipts. • Pesticide use data not available • Modern pesticides may be less toxic, but it is not tracked.