
Analyzing Tuition Trends of Private Colleges: 1995-2002
This guide explores the average tuition rates for private four-year colleges in the U.S. from 1995 to 2002, presenting methods to model the data using linear and exponential regression techniques. We begin by creating scatter plots of the tuition data and employing a graphing calculator to find the best-fitting models. Two examples highlight the linear model fit (y = 933x + 14,600) and an exponential model for cooling rates. Practice exercises are included to reinforce understanding of regression modeling in real-world applications.

Analyzing Tuition Trends of Private Colleges: 1995-2002
E N D
Presentation Transcript
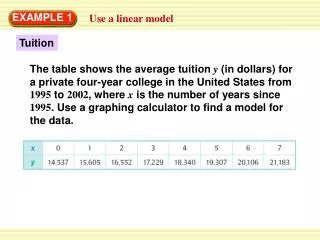
The table shows the average tuition y(in dollars) for a private four-year college in the United States from 1995 to 2002, where xis the number of years since 1995. Use a graphing calculator to find a model for the data. EXAMPLE 1 Use a linear model Tuition
Make: a scatter plot. The points lie approximately on a line. This suggests a linear model. Use: the linear regression feature to find an equation of the model. EXAMPLE 1 Use a linear model SOLUTION STEP 1 STEP 2
Graph: the model along with the data to verify that the model fits the data well. A model for the data is y =933x+14,600. ANSWER EXAMPLE 1 Use a linear model STEP 3
You are storing leftover chili in a freezer. The table shows the chili’s temperature y(in degrees Fahrenheit) after xminutes in the freezer. Use a graphing calculator to find a model for the data. EXAMPLE 2 Use an exponential model Cooling Rates
Make: a scatter plot. The points fall rapidly at first and then begin to level off. This suggests an exponential decay model. Use: the exponential regression feature to find an equation of the model. EXAMPLE 2 Use an exponential model SOLUTION STEP 1 STEP 2
Graph: the model along with the data to verify that the model fits the data well. ANSWER A model for the data is y= 98.2(0.969)x. EXAMPLE 2 Use an exponential model SOLUTION STEP 3
1. SOLUTION f (x) = 0.0106x2 + 0.116x + 21.6 for Examples 1 and 2 GUIDED PRACTICE Use a graphing calculator to find a model for the data. Then graph the model and the data in the same coordinate plane.
2. SOLUTION f (x) = 12.2x + 30.3 for Examples 1 and 2 GUIDED PRACTICE


