
Uploaded by
eldora
1 SLIDES
130 VIEWS
10LIKES
Efficient Pie Chart Representation for Data Segmentation Analysis
DESCRIPTION
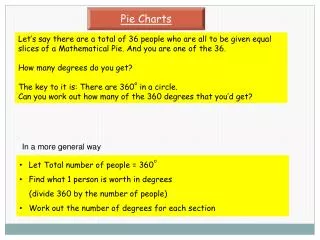
This segment presents a comprehensive view of data segmentation using pie chart visualization. The pie chart is an effective tool for illustrating the proportional data distribution across different categories. By leveraging this method, analysts can quickly identify trends, exceptions, and key insights. This resource provides detailed analysis and instructional guidance on creating and interpreting pie charts, enhancing data-driven decision-making processes for businesses and researchers alike.
Download

1 / 1
Download Presentation 
Efficient Pie Chart Representation for Data Segmentation Analysis
An Image/Link below is provided (as is) to download presentation
Download Policy: Content on the Website is provided to you AS IS for your information and personal use and may not be sold / licensed / shared on other websites without getting consent from its author.
Content is provided to you AS IS for your information and personal use only.
Download presentation by click this link.
While downloading, if for some reason you are not able to download a presentation, the publisher may have deleted the file from their server.
During download, if you can't get a presentation, the file might be deleted by the publisher.
E N D


More Related