Download
1 / 37
370 likes | 589 Views
Recent Carbon Trends and the Global Carbon Budget updated to 2006. GCP-Global Carbon Budget team: Pep Canadell, Philippe Ciais, Thomas Conway, Chris Field, Corinne Le Quéré, Skee Houghton, Gregg Marland, Mike Raupach, Erik Buitenhuis, Nathan Gillett. Last update: 13 June 2008. Outline.

E N D
Recent Carbon Trends and the Global Carbon Budgetupdated to 2006 GCP-Global Carbon Budget team: Pep Canadell, Philippe Ciais, Thomas Conway, Chris Field, Corinne Le Quéré, Skee Houghton, Gregg Marland,Mike Raupach, Erik Buitenhuis, Nathan Gillett Last update: 13 June 2008
Outline • Recent global carbon trends (2000-2006) • The perturbation of the global carbon budget (1850-2006) • The declining efficiency of natural CO2 sinks • Attribution of the recent acceleration of atmospheric CO2 • Conclusions and implications for climate change
1. Recent global carbon trends
Anthropogenic C Emissions: Land Use Change Tropical deforestation 13 Million hectares each year Borneo, Courtesy: Viktor Boehm 2000-2005 Tropical Americas 0.6 Pg C y-1 Tropical Asia 0.6 Pg C y-1 Tropical Africa 0.3 Pg C y-1 1.5 Pg C y-1 FAO-Global Resources Assessment 2005; Canadell et al. 2007, PNAS
2000-2006 1.5 Pg C y-1 (16% total emissions) Africa Latin America S. & SE Asia SUM Anthropogenic C Emissions: Land Use Change Carbon Emissions from Tropical Deforestation 1.80 1.60 1.40 1.20 1.00 Pg C yr-1 0.80 0.60 0.40 0.20 0.00 2000 1990 1980 1860 1870 1890 1900 1930 1940 1950 1970 1850 1880 1910 1920 1960 Houghton, unpublished
1850 1870 1890 1910 1930 1950 1970 1990 2010 Anthropogenic C Emissions: Fossil Fuel 2006 Fossil Fuel: 8.4 Pg C [2006-Total Anthrop. Emissions:8.4+1.5 = 9.9 Pg] • 1990 - 1999: 1.3% y-1 • 2000 - 2006: 3.3% y-1 Raupach et al. 2007, PNAS; Canadell et al 2007, PNAS
Trajectory of Global Fossil Fuel Emissions SRES (2000) growth rates in % y -1 for 2000-2010: A1B: 2.42 A1FI: 2.71 A1T: 1.63 A2: 2.13 B1: 1.79 B2: 1.61 Raupach et al. 2007, PNAS
SRES (2000) growth rates in % y -1 for 2000-2010: A1B: 2.42 A1FI: 2.71 A1T: 1.63 A2: 2.13 B1: 1.79 B2: 1.61 Observed 2000-2006 3.3% Trajectory of Global Fossil Fuel Emissions Raupach et al. 2007, PNAS
Carbon Intensity of the Global Economy Kg Carbon Emitted to Produce 1 $ of Wealth Photo: CSIRO Carbon intensity (KgC/US$) 1960 1970 1980 1990 2000 2006 Canadell et al. 2007, PNAS
Population Wealth = per capita GDP Carbon intensity of GDP Drivers of Anthropogenic Emissions 1.5 1.5 1.5 World 1.4 1.4 1.4 1.3 1.3 1.3 1.2 1.2 1.2 1.1 1.1 1.1 1 Factor (relative to 1990) 1 1 0.9 0.9 0.9 0.8 0.8 0.8 Emissions F (emissions) P (population) 0.7 0.7 0.7 g = G/P 0.6 0.6 0.6 h = F/G 0.5 0.5 0.5 1980 1985 1990 1995 2000 2005 1980 1980 Raupach et al 2007, PNAS
Regional Pathways (Kaya identity) C emissions Wealth pc Population C Intensity Developed Countries (-) Developing Countries Least Developed Countries Raupach et al 2007, PNAS
Anthropogenic C Emissions: Regional Contributions 100% D3-Least Developed Countries 80% D2-Developing Countries 60% India 40% China FSU 20% D1-Developed Countries Japan EU 0% USA Cumulative Emissions [1751-2004] Flux in 2004 Population in 2004 Flux Growth in 2004 Raupach et al. 2007, PNAS
[CO2] 1850 1870 1890 1910 1930 1950 1970 1990 2010 • 1970 – 1979: 1.3 ppm y-1 1980 – 1989: 1.6 ppm y1 • 1990 – 1999: 1.5 ppm y-1 • 2000 - 2006: 1.9 ppm y-1 Atmospheric CO2 Concentration Year 2007 Atmospheric CO2 concentration: 382.6 ppm 35% above pre-industrial NOAA 2007; Canadell et al. 2007, PNAS
2. • The perturbation of the global carbon cycle (1850-2006)
Perturbation of Global Carbon Budget (1850-2006) 2000-2006 deforestation Source tropics extra-tropics 1.5 CO2 flux (Pg C y-1) Sink Time (y) Le Quéré, unpublished; Canadell et al. 2007, PNAS
Perturbation of Global Carbon Budget (1850-2006) 2000-2006 fossil fuel emissions 7.6 Source deforestation 1.5 CO2 flux (Pg C y-1) Sink Time (y) Le Quéré, unpublished; Canadell et al. 2007, PNAS
Perturbation of Global Carbon Budget (1850-2006) 2000-2006 fossil fuel emissions 7.6 Source deforestation 1.5 CO2 flux (Pg C y-1) Sink Time (y) Le Quéré, unpublished; Canadell et al. 2007, PNAS
Perturbation of Global Carbon Budget (1850-2006) 2000-2006 fossil fuel emissions 7.6 Source deforestation 1.5 CO2 flux (Pg C y-1) atmospheric CO2 4.1 Sink Time (y) Le Quéré, unpublished; Canadell et al. 2007, PNAS
Perturbation of Global Carbon Budget (1850-2006) 2000-2006 fossil fuel emissions 7.6 Source deforestation 1.5 CO2 flux (Pg C y-1) atmospheric CO2 4.1 Sink ocean 2.2 Time (y) Le Quéré, unpublished; Canadell et al. 2007, PNAS
Perturbation of Global Carbon Budget (1850-2006) 2000-2006 fossil fuel emissions 7.6 Source deforestation 1.5 CO2 flux (Pg C y-1) atmospheric CO2 4.1 Sink land 2.8 ocean 2.2 Time (y) Le Quéré, unpublished; Canadell et al. 2007, PNAS
Carbon intensity (KgC/US$) Source Carbon flux (Pg C y-1) CO2 flux (Pg CO2 y-1) Sink Time (y) Perturbation of the Global Carbon Budget (1959-2006) Canadell et al. 2007, PNAS
3. The declining efficiency of natural sinks
4.1 Pg y-1 Atmosphere 45% 2.8 Pg y-1 + Land 30% 7.6 Pg C y-1 2.2 Pg y-1 Oceans 25% Fate of Anthropogenic CO2 Emissions (2000-2006) 1.5 Pg C y-1 Canadell et al. 2007, PNAS
Climate Change at 55% Discount Natural sinks absorb 5 billions tons of CO2 globally every year, or 55% of all anthropogenic carbon emissions. Canadell et al. 2007, PNAS
Natural Sinks: Large Economic Subsidy Natural sinks are a huge subsidy to our global economy worth half a trillion Euros annually if an equivalent sink had to be created using other climate mitigation options (based on the cost of carbon in the EU-ETS). Canadell & Raupach 2008, Science
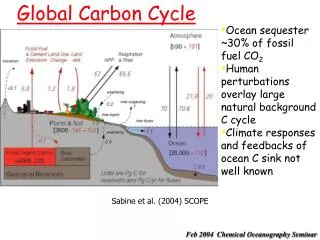
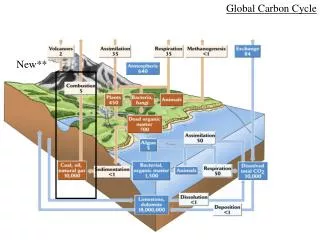
The rate of CO2 emissions. The rate of CO2 uptake and ultimately the total amount of C that can be stored by land and oceans: Land: CO2 fertilization effect, soil respiration, N deposition fertilization, forest regrowth, woody encroachment, … Oceans: CO2 solubility (temperature, salinity),, ocean currents, stratification, winds, biological activity, acidification, … Factors that Influence the Airborne Fraction Canadell et al. 2007, Springer; Gruber et al. 2004, Island Press
Emissions 1 tCO2 400Kg stay Emissions 1 tCO2 450Kg stay Decline in the Efficiency of CO2 Natural Sinks Fraction of anthropogenic emissions that stay in the atmosphere % CO2 Emissions in Atmosphere 1960 2000 1990 1970 1980 2006 Canadell et al. 2007, PNAS
Efficiency of Natural Sinks Land Fraction Ocean Fraction Canadell et al. 2007, PNAS
Part of the decline is attributed to up to a 30% decrease in the efficiency of the Southern Ocean sink over the last 20 years. This sink removes annually 0.7 Pg of anthropogenic carbon. The decline is attributed to the strengthening of the winds around Antarctica which enhances ventilation of natural carbon-rich deep waters. The strengthening of the winds is attributed to global warming and the ozone hole. Causes of the Declined in the Efficiency of the Ocean Sink Credit: N.Metzl, August 2000, oceanographic cruise OISO-5 Le Quéréet al. 2007, Science
NDVI Anomaly 1982-2004 [Normalized Difference Vegetation Index] Summer 1982-1991 Summer 1994-2002/04 Drought Effects on the Mid-Latitude Carbon Sinks A number of major droughts in mid-latitudes have contributed to the weakening of the growth rate of terrestrial carbon sinks in these regions. Angert et al. 2005, PNAS; Buermann et al. 2007, PNAS; Ciais et al. 2005, Science
4. • Attribution of the recent acceleration of atmospheric CO2
Attribution of Recent Acceleration of Atmospheric CO2 • 1970 – 1979: 1.3 ppm y-1 1980 – 1989: 1.6 ppm y1 • 1990 – 1999: 1.5 ppm y-1 • To: • Economic growth • Carbon intensity • Efficiency of natural sinks • 2000 - 2006: 1.9 ppm y-1 65% - Increased activity of the global economy 17% - Deterioration of the carbon intensity of the global economy 18% - Decreased efficiency of natural sinks Canadell et al. 2007, PNAS
5. Conclusions and implications for climate change
The growth of carbon emissions from fossil fuels has tripled compared to the 1990s and is exceeding the predictions of the highest IPCC emission scenarios. Conclusions (i) Since 2000: • Atmospheric CO2 has grown at 1.9 ppm per year (compared to about 1.5 ppm during the previous 30 years) • The carbon intensity of the world’s economy has stopped decreasing (after 100 years of doing so).
Conclusions (ii) • The efficiency of natural sinks has decreased by 10% over the last 50 years (and will continue to do so in the future), implying that the longer we wait to reduce emissions, the larger the cuts needed to stabilize atmospheric CO2. • All of these changes characterize a carbon cycle that is generating stronger climate forcing and sooner than expected.
Angert A, Biraud S, Bonfils C, Henning CC, Buermann W, Pinzon J, Tucker CJ, Fung I (2005) PNAS 102:10823-10827. Breshears DD, Cobb NS, Richd PM, Price KP, Allen CD (2005) PNAS 42:15144-15148. Canadell JG, Corinne Le Quéré, Michael R. Raupach, Christopher B. Field, Erik T. Buitehuis, Philippe Ciais, Thomas J. Conway, NP Gillett, RA Houghton, Gregg Marland (2007) PNAS. Canadell JG, Pataki D, Gifford R, Houghton RA, Lou Y, Raupach MR, Smith P, Steffen W (2007) in Terrestrial Ecosystems in a Changing World, eds Canadell JG, Pataki D, Pitelka L (IGBP Series. Springer-Verlag, Berlin Heidelberg), pp 59-78. Ciais P, Reichstein M, Viovy N, Granier A, Ogée, J, V. Allard V, Aubinet M, Buchmann N, Bernhofer Ch, Carrara A, et al. (2005) Nature 437:529-533. Raupach MR, Marland G, Ciais P, Le Quéré C, Canadell JG, Klepper G, Field CB, PNAS (2007) 104: 10288-10293. Global Forest Resource Assessment (2005) FAO Forestry Paper 147. Gruber N, Friedlingstein P, Field CB, Valentini R, Heimann M, Richey JF, Romero P, Schulze E-D, Chen A (2004) in Global Carbon Cycle, integrating human, climate, and the natural world, Field CB, Raupach M (eds). Island Press, Washington, DC., pp 45-76 Le Quéré C, Rödenbeck C, Buitenhuis ET, Thomas J, Conway TJ, Langenfelds R, Gomez A, Labuschagne C, Ramonet M, Nakazawa T, Metzl N, et al. (2007) Science 316:1735-1738. Canadell JG, Raupach MR (2008) Forest management for climate change mitigation. Science 320, 1456-1457, doi: 10.1126/science.1155458. References
www.globalcarbonproject.org info@globalcarbonproject.org