Precision Weather Modelling, Analytics and Visualization for Emergency Management
230 likes | 364 Views
This paper presents innovative weather modeling, analytics, and visualization strategies designed for emergency management. It identifies the challenges faced by weather-sensitive businesses and proposes a solution that utilizes reliable weather and impact models for proactive and predictive decision-making. By integrating numerical weather forecasts with business processes, the approach enhances efficiency and safety across industries such as energy, transportation, and agriculture. Enhanced predictive capabilities enable organizations to allocate resources proactively and mitigate risks associated with adverse weather events.

Precision Weather Modelling, Analytics and Visualization for Emergency Management
E N D
Presentation Transcript
Precision Weather Modelling, Analytics and Visualization for Emergency Management Anthony P. Praino, Lloyd A. Treinish, James P. Cipriani IBM Thomas J. Watson Research Center Yorktown Heights, NY
Precision Weather Modelling, Analytics and Visualization for Emergency Management • Problem: weather-sensitive business operations are often reactive to short-term (few hours to a few days), local conditions (city, county, state) due to unavailability of appropriate predicted data at this scale • Energy, transportation, agriculture, insurance, broadcasting, sports, entertainment, tourism, construction, communications, emergency planning and disaster warnings • Solution: application of reliable, affordable, weather and impact models for predictive and proactive decision making and operational planning • Numerical weather forecasts coupled to business processes models • Products and operations customized to business problems • Competitive advantage -- efficiency, safety, security and economic & societal benefit
Weather Model Configuration for New York • Three 2-way nests at 18, 6, 2 km • horizontal resolution • 42 vertical levels • 84 hour runs twice daily • NOAA NAM for background and • lateral boundary conditions • Post NWP electrical distribution • outage prediction model 2 km 6 km 18 km
2km 2km Central Park Weather Station Match the Scale of the Weather Model to Application Requirements • Capture the geographic characteristics that affect weather (horizontally, vertically, temporally) • Ensure that the weather forecasts address the features that matter to the business
Short-Term Weather Event Prediction and Observation Nowcasting (Sensors) Forecasting (Modelling) NWS / Commercial Providers Deep Thunder Remote In Situ Forecast for longer-term planning where decisions require days of lead time, but may not have direct coupling to business processes Forecast for asset-based decisions to manage weather event, pre-stage resources and labor proactively Fine-tune approach based upon extrapolation from Doppler radar and satellite observations Near-real time revision Continental to Global Scale Local Scale Local Scale 72-168 3 0 18-72 Time Horizon for a Local Weather Event (Hours of Lead Time)
Approach • It is not about weather but integrating forecasts into decision making to optimize business processes • “You don't get points for predicting rain. You get points for building arks.” (Former IBM CEO, Lou Gerstner) • For example, the operation of an electric or water utility or a city government can be highly sensitive to local weather conditions • What is the potential to enable proactive allocation and deployment of resources (people and equipment) to mitigate damage, and minimize time for restoration? • Ability to predict specific events or combination of weather conditions and their impact that can disrupt infrastructure • Rather than monitor a storm, stage resources at the right place and time prior to the event to minimize the impact (i.e., plan not react) • Sufficient spatial and temporal precision, and lead time to reduce the uncertainty in decision making • Integration with end user business applications (i.e., analytics and visualization) • Delivery as a service tailored for the geographic, throughput and dissemination requirements of the client
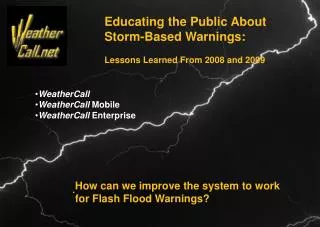
Road Weather Applications • More precise predictions of the location and timing of severe weather (e.g., thunderstorms, strong winds, heavy snow and rain, freezing temperatures, fog) could help recover the multi-billion dollar annual cost of weather-related delays on and damage to roads in the U.S., by enabling the following: • Transportation officials could initiate recovery plans for both operations and traffic management before weather-induced disruptions actually occur • The public, commercial transportation companies, schools and emergency services could better plan for how and when they would travel • Highway supervisors could more efficiently schedule, staff and equip for deicing and snow removal operations during the winter
29 October 2011 “Surprise” • Classic nor'easter leading to heavy snow in the north eastern US, except for the date, which led to significant new records for snow totals • Snow was widespread, wet and heavy, with totals over 2 feet in some areas, damaging millions of trees • Wind gusts up to 50-60 mph were recorded • Electric utility and transportation systems were widely disrupted (over 2 million homes lost power) Reported Snowfall
Deep Thunder Prediction of 29 October “Surprise” Snow • Good agreement in snow totals, geographic distribution, and start and stop times • Initiated with data from 0800 EDT on 10/28 with results available 18 hours before snow began
28 August 2011: Hurricane Irene New York City Metro Area • Sustained winds 40 to 52 mph with gusting 60 to 90 mph and heavy rains (over 10” in some areas) • Innumerable downed trees and power lines, and local flooding and evacuations • Electricity service lost to about 1M residences and businesses (half of CT) • Widespread disruption of transportation systems (e.g., road and bridge closures, airport and rail delays) • Others forecasted storm as Category 1 or 2 but actually tropical storm at landfall • Hence, expectation of much greater impacts of wind, and far less impact from heavy rainfall
Deep Thunder New York Forecast for Tropical Storm Irene • Fourth of six operational forecasts covering the event confirming the earlier forecast of tropical storm not hurricane strength at landfall and showing the track to the north • Heavy rainfall predicted with similar distribution to reported rainfall Visualization of Clouds, Wind and Precipitation, including Rain Bands
Deep Thunder New York Forecast for Tropical Storm Irene: Afternoon of 27 August 2011 • Initiated with data from 0800 EDT on 8/27 with results available in the late afternoon • Shows rainfall beginning in parts of New York City in the evening on 8/27 and ending the afternoon of 8/28 • Sustained winds in parts of New York City well below hurricane strength
Deep Thunder Wind Forecast for Tropical Storm Irene:Afternoon of 27 August 2011 Maximum Sustained Wind Maximum Daily Gust 13
Tropical Storm Irene Deep Thunder Impact Forecast Estimated Outages per Substation(Repair Jobs) Actual Number of Repair Jobs per Substation Area (Total = 1953) Likelihood (Probability) of a Range of Repair Jobs per Substation (Right) High Severity (> 100 Jobs) (Left) Moderate Severity (51 to 100 Jobs)
Example Event and Forecast: New York City Severe Thunderstorms – 07 August 2007 • On August 8, 2007, New York City area became an epicenter of a Mesoscale Convective System (MCS) with rainfall exceeding three inches in less than two hours in some areas • The subway system was partially closed due to flooding, streets were impassable, about 2.3 million people and numerous businesses were affected • Available operational forecasts did not predict this event, as a result area agencies and businesses were unprepared • Rainfall started just before 0600 EDT and lasted about two hours • Total rainfall ranged from 1.4 to 4.2 inches Snapshot from NexRad KOKX at 6:30 AM EDT on August 8, 2007
Flooding Estimate for August 8, 2007 • Intense localized cells and flash flooding in Queens (and Brooklyn) • Rainfall estimates from Deep Thunder forecast initialized at 2000 EDT on 7 Aug 2007 was used in a GIS-based hydrology model to examine flooding patterns and impact on urban infrastructure Hillside Ave Flooding. “August 8, 2007: Storm Report.” Metropolitan Transportation Authority, 9/20/2007, page 23.
IBM Deep Thunder and the Integrated Command Center in Rio de Janeiro Mitigating the impact of severe weather events is the top priority for the client to enable effective planning and response to emergencies • 48-hour forecast updated every 12 hours at 1 km resolution with the physics for the urban environment, sub-tropical micro-meteorology and complex topography • Disseminated via a web portal at the client site through specialized visualizations • Coupled flooding model (see below) Three-dimensional forecasted clouds with terrain surface and precipitation overlaid with arrows for wind speed & direction (above) and estimated surface runoff from heavy rainfall (below)
Summary • High-resolution physical weather modelling can provide significant value in predicting environmental impacts at a local as well as regional scales • A key aspect is the customization of the models for specific applications coupled with the decision making • Visualization is critical for decision making by people and the workflow required • Integration with other models as well as existing infrastructure enables actionable, proactive behavior • Positive stakeholder as well as economic and societal benefits can be realized in the application of the end-user-focused methodology • Future work will focus on coupling and integrating models for specific applications and enabling broader solutions within an “Integrated Operations Center”
Alerts from Deep Thunder within the Intelligent Operations Center
Backup Slides
What is Weather Modelling? • A mathematical model that describes the physics of the atmosphere • The sun adds energy, gases rise from the surface, convection causes winds • Numerical weather prediction is done by solving the equations of these models on a 4-dimensional grid (e.g., latitude, longitude, altitude, time) • Complementary to observations (e.g., NWS weather stations) • Solution yields predictions of surface and upper air • Temperature, humidity, moisture • Wind speed and direction • Cloud cover and visibility • Precipitation type and intensity
Approach to Urban Flood Forecasting Precipitation Estimates Weather Prediction and/or Rainfall Measurements Analysis of Precipitation Flood Prediction Refine Sensor Network and Model Calibration Actual Flood Impacts Model Calibration Impact Estimates
IBM Intelligent Operations Center (IOC) for Transportation, Cities, Utilities, etc. • Integrating the most repeatable best practice patterns: • Leveraging information: • Citywide visibility across entire networks (utilities, transportation, water) and city services to improve incident response • Create insights from data to build a safer, more efficient and more accountable place to live and conduct business • Gain real-time and system wide visibility of traffic and transit networks • Create awareness of significant events and problem areas • Anticipating problems: • Analyze traffic performance to alleviate congestion • Identify patterns and anticipate incidents impacting traffic congestion and transit schedules enabling improvement strategies • Increase efficiency and deliver situational awareness to first responders using predictive analytics • Uncover hidden connections faster, deliver timely and actionable results to protect citizens • Coordinating resources: • Centralize monitoring and transit arrival prediction to improve the travelers’ experience • With traffic prediction and pro-active traffic management, reduce citizen aggravation and negative commercial impact • Ensure consistent service & better informed commuters with vehicle arrival prediction Environmental