Download
1 / 5
0 likes | 3 Views
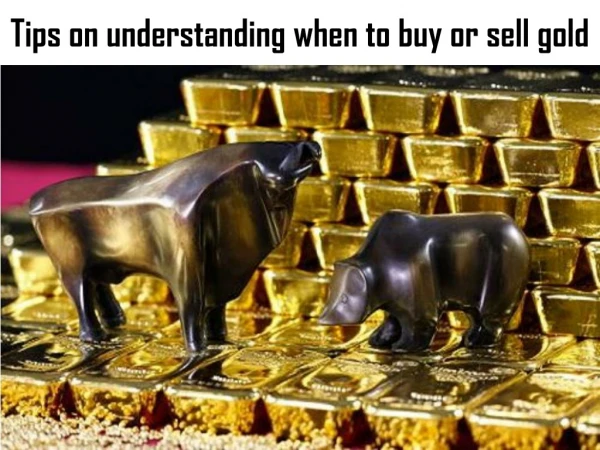
Have you ever thought of trading in Bitcoin and making a high profit from it? Well, if so, then you are not the only one. <br><br>Bitcoin is regarded as the father of cryptocurrency. Being the first, oldest, and most popular cryptocurrency, traders always look for opportunities to trade bitcoin. <br><br>If you are also looking for bitcoin opportunities, this article is for you. Here, we will discuss top Bitcoin buy or sell indicators. First, letu2019s give a short overview of Bitcoin. <br><br>

E N D
Understanding Bitcoin Buy or Sell Indicators Bitcoin, the world's first and most well-known cryptocurrency, has been a subject of fascination and speculation since its inception in 2009. Its volatile price movements have drawn investors, traders, and institutions eager to profit from the market. But navigating Bitcoin's ups and downs requires more than just gut feeling—it demands a solid understanding of buy and sell indicators. In this blog, we’ll explore what these indicators are, how they work, and how you can use them to make more informed trading decisions. What Are Buy or Sell Indicators? Buy or sell indicators are tools or signals that help traders decide when to enter or exit a position in the market. These indicators are derived from historical price data, volume, market sentiment, or a combination of various factors. They don't guarantee success, but they can significantly improve your chances of making profitable trades when used correctly. There are two primary types of indicators: •Technical Indicators: Based on historical price and volume data. •Sentiment Indicators: Reflect trader behavior and market mood. Let’s dive into the most commonly used Bitcoin buy and sell indicators. Popular Technical Indicators for Bitcoin 1. Moving Averages (MA) Moving averages are one of the most straightforward and commonly used indicators. They smooth out price action and help identify trends over time. •Simple Moving Average (SMA): This is the average price over a specific time period (e.g., 50-day or 200-day SMA). •Exponential Moving Average (EMA): Places more weight on recent prices, making it more responsive to new information. Buy Signal: When the short-term MA crosses above the long-term MA (Golden Cross). Sell Signal: When the short-term MA crosses below the long-term MA (Death Cross).
2. Relative Strength Index (RSI) RSI measures the speed and change of price movements on a scale of 0 to 100. •Above 70: Overbought (potential sell signal) •Below 30: Oversold (potential buy signal) Traders use RSI to spot possible reversals and entry/exit points. 3. MACD (Moving Average Convergence Divergence) MACD is a trend-following momentum indicator that shows the relationship between two EMAs (typically the 12-day and 26-day). Buy Signal: When the MACD line crosses above the signal line. Sell Signal: When it crosses below. MACD histograms can also help detect the strength of the trend. 4. Bollinger Bands Bollinger Bands consist of a middle band (SMA) and two outer bands that represent price volatility. •When the price touches the lower band, it may indicate an oversold condition (buy). •When it touches the upper band, it could signal overbought conditions (sell). It’s especially useful in a ranging market. Sentiment-Based Indicators 1. Fear and Greed Index This index combines various data points such as volatility, volume, social media trends, and surveys to gauge market sentiment. •Extreme Fear: Could indicate a buying opportunity. •Extreme Greed: Often a sign of an impending correction or sell-off. It’s not precise, but it helps to understand the broader psychological backdrop.
2. Funding Rates and Open Interest These are often used in futures and derivatives markets: •Positive Funding Rate: More traders are long; market could be over-leveraged (bearish). •Negative Funding Rate: More shorts; could indicate a potential bounce (bullish). Tracking these metrics can help spot crowd behavior and possible contrarian setups. Volume as a Confirmation Tool Volume is critical in confirming the strength of a price move. A price breakout with strong volume indicates conviction, while one with low volume might be a fake-out.
Buy Signal: Price breaks resistance with high volume. Sell Signal: Price breaks support with high volume. Volume analysis works best when used in combination with other indicators. Combining Indicators for Better Accuracy No single indicator should be relied on in isolation. The best traders use a combination of tools to filter out false signals and strengthen their strategies. Example Strategy: 1.RSI < 30 (Oversold) 2.MACD crossover (Bullish) 3.Price at lower Bollinger Band 4.High volume breakout All these together may indicate a strong buy setup. Similarly, the same logic can be used for sell signals. Combining indicators helps reduce the risk of acting on noise or market randomness. Caveats and Considerations •False Signals: Indicators are not foolproof. Whipsaws and fakeouts are common. •Lagging Nature: Most technical indicators are based on past data and may lag behind real-time market movements. •Market News: Always consider major news events or macroeconomic developments. A tweet or regulation update can override all technical setups. •Risk Management: Always use stop-losses and define your risk. Indicators help with timing, but risk control is key to long-term success. Final Thoughts Understanding Bitcoin buy and sell indicators is essential for anyone looking to trade or invest in the crypto market. These tools offer a structured approach to decision-making, taking the guesswork out of timing entries and exits.
However, indicators should not replace critical thinking or due diligence. They are best used as part of a broader trading strategy that includes technical analysis, fundamental awareness, and proper risk management. If you're just starting out, focus on learning one or two indicators in depth before combining them into your strategy. With practice and patience, you'll gain more confidence in reading the signals and navigating the Bitcoin market with greater precision.