Download
1 / 4
0 likes | 2 Views
Gold has long been a popular asset among traders and investors alike, renowned for its ability to retain value during economic uncertainty. Whether you're a seasoned investor or just starting your journey in commodities trading, understanding how to confirm gold trading signals is crucial to trading with confidence and accuracy.<br><br>

E N D
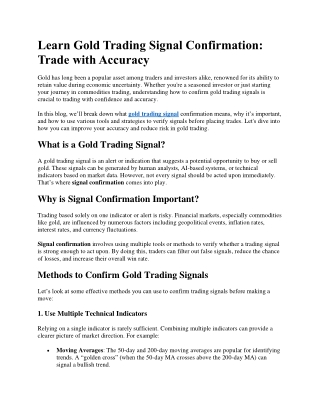
Learn Gold Trading Signal Confirmation: Trade with Accuracy Gold has long been a popular asset among traders and investors alike, renowned for its ability to retain value during economic uncertainty. Whether you're a seasoned investor or just starting your journey in commodities trading, understanding how to confirm gold trading signals is crucial to trading with confidence and accuracy. In this blog, we’ll break down what gold trading signalconfirmation means, why it’s important, and how to use various tools and strategies to verify signals before placing trades. Let's dive into how you can improve your accuracy and reduce risk in gold trading. What is a Gold Trading Signal? A gold trading signal is an alert or indication that suggests a potential opportunity to buy or sell gold. These signals can be generated by human analysts, AI-based systems, or technical indicators based on market data. However, not every signal should be acted upon immediately. That’s where signal confirmation comes into play. Why is Signal Confirmation Important? Trading based solely on one indicator or alert is risky. Financial markets, especially commodities like gold, are influenced by numerous factors including geopolitical events, inflation rates, interest rates, and currency fluctuations. Signal confirmation involves using multiple tools or methods to verify whether a trading signal is strong enough to act upon. By doing this, traders can filter out false signals, reduce the chance of losses, and increase their overall win rate. Methods to Confirm Gold Trading Signals Let’s look at some effective methods you can use to confirm trading signals before making a move: 1. Use Multiple Technical Indicators Relying on a single indicator is rarely sufficient. Combining multiple indicators can provide a clearer picture of market direction. For example: •Moving Averages: The 50-day and 200-day moving averages are popular for identifying trends. A “golden cross” (when the 50-day MA crosses above the 200-day MA) can signal a bullish trend.
•Relative Strength Index (RSI): Measures momentum and overbought/oversold conditions. An RSI above 70 suggests overbought conditions; below 30 suggests oversold. •MACD (Moving Average Convergence Divergence): Useful for spotting trend reversals and momentum. Look for signal line crossovers or divergence between price and MACD lines. When two or more of these indicators align, it gives stronger confirmation of the trade direction. 2. Check Volume Analysis Volume is a key confirmation tool. An increase in volume along with price movement adds weight to the signal. For instance, if gold breaks a resistance level on high volume, it’s more likely to sustain the move than if the breakout happens on low volume. 3. Analyze Price Action Price action refers to the movement of gold prices plotted over time. Look for patterns such as:
•Support and resistance levels: Price bouncing off support or resistance zones multiple times shows strong market behavior. •Candlestick patterns: Engulfing patterns, doji, hammer, and shooting star can indicate reversals or continuations. Combine candlestick patterns with support/resistance for a solid confirmation setup. 4. Consider Fundamental Factors Gold prices react significantly to global news and economic indicators. Before entering a trade, check: •U.S. Dollar strength: Since gold is priced in USD, they typically move inversely. •Interest rates and inflation data: Higher inflation often drives gold prices higher as it’s seen as a hedge. •Geopolitical tensions: Unrest or uncertainty can lead to increased demand for gold as a safe haven. By combining technical and fundamental confirmation, you enhance your decision-making process. 5. Use Time Frame Alignment Traders often make the mistake of looking only at one time frame. Signal confirmation improves when multiple time frames are aligned. For example: •A signal on the 15-minute chart may seem valid, but if the 4-hour or daily chart is showing an opposing trend, the trade might be riskier. •Ideally, look for signals that line up across short-, mid-, and long-term charts for higher accuracy. 6. Trade Sentiment Analysis Market sentiment tools, such as Commitment of Traders (COT) reports or sentiment indices, can give insight into what large institutional players are doing. If the sentiment supports your technical signal, it acts as an additional layer of confirmation. Example of Signal Confirmation in Gold Trading Let’s say you receive a buy signal for gold at$2,000. Here’s how you might confirm it: •Technical Indicators: RSI is at 40 and rising, MACD shows a bullish crossover, and price just crossed the 50-day MA. •Volume: A surge in volume accompanies the breakout. •Price Action: Price formed a bullish engulfing candle above a previous resistance level.
•Fundamentals: Recent inflation data was higher than expected, pushing investors toward gold. •Time Frame Alignment: The breakout is visible and supported on both 1-hour and 4- hour charts. This level of multi-layered confirmation helps you execute a trade with much greater confidence. Final Thoughts Learning how to confirm gold trading signals isn’t just a smart tactic —it’s essential for long- term trading success. Instead of reacting to every alert, take the time to validate it with technical indicators, price action, fundamentals, and broader market sentiment. Remember, the goal is not to catch every move, but to catch high-probability trades that increase your win ratio and protect your capital. With consistent practice, you'll not only learn to spot quality signals but also trade with the kind of accuracy that separates amateurs from professionals. Happy trading, and may your gold trades shine bright!