1 / 1
0 likes | 3 Views
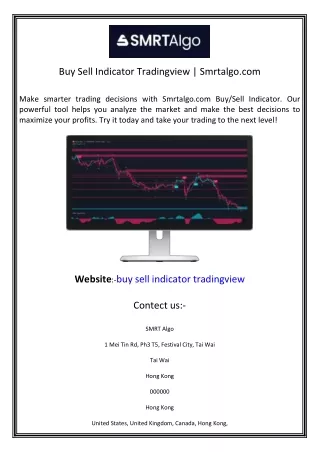
Identifying when to buy or sell is such a crucial task in trading. Traders use a number of ways to determine potential trading opportunities. What if I tell you another good way of spotting profitable trades? <br><br>Yes, technical analysis indicators can help you with that. These data-based tools help you in identifying the right opportunity. Being a leading signal provider, Carlos and Company understands the importance of the buy-sell indicator. So, let us explore what it means and how to use it.<br><br>

E N D
Need Best Consultation? Need Best Consultation? See How It Works Home About Us Our Services Research Contact Us Quick Payment Get Started See How We work Attain free demo with our consultant Buy Sell Indicator: Top Tools and learn to use them effectively Name Name Identifying when to buy or sell is such a crucial task in trading. Traders use a number of ways to determine Email potential trading opportunities. What if I tell you another good way of spotting profitable trades? Email Yes, technical analysis indicators can help you with that. These data-based tools help you in identifying the right Phone Number opportunity. Being a leading signal provider, Carlos and Company understands the importance of the buy-sell Phone number indicator. So, let us explore what it means and how to use it. Country Country HERE'S A QUICK LOOK AT WHAT YOU'LL READ START TRIAL What is a buy-sell indicator? We work hard toanalyze market What are the top buy-sell indicators? What are the tips for using trading indicators effectively? Which is the best buy-sell indicator? You may also like to Read What is a Buy-Sell Indicator? Effects of covid-19 on global economy A buy-sell indicator is a technical analysis tool that During the recession, there is a big question undertakes charts and price patterns in order to provide Read More » trade entry and exit insights. These tools help traders make informed trade decisions based on historical How does the data. Fundamental Analysis work? Indicators are quite useful in trading to get valuable How Does The Fundamental Analysis Work Fundamental analysis trade insights. These are based on mathematical calculations and statistical data. Read More » The number never lies, so the interpretations that these indicators give are quite accurate. Forex Investment Forex Investment Investment is a great option to With buying and selling levels, the trading indicators also tell about crucial information. It includes potential turning Read More » points, overbought and oversold conditions, support and resistance, volatility, liquidity, and volume. Demo currency trading Top Buy and Sell indicators account Demo currency trading account Have you ever thought Numerous indicators are present in the trading world that directly or indirectly suggest buying and selling opportunities. We cannot discuss everything, and not all of them are important to you. So, let us discuss the top Read More » indicators: Trading commodities Major Exchange Platform for Trading Commodities The scope Relative Strength Index RSI is amongst the popular indicators that help to identify overbought and oversold conditions. Experts and Read More » advanced traders use these indicators to generate potential buy and sell signals. Stock Market Basics The indicator has a range of 0 to 100, and the range at which the price is moving determines what moves a trader for Beginners will make. When the price moves below 30, it indicates oversold conditions that suggest traders buy. Meanwhile, Stock Market Basics for Beginners Are you a when the price moves above 70, it indicates overbought conditions that suggest traders sell. Read More » Moving Averages Moving Averages are widely used indicators for trading forex, stocks, commodities, cryptocurrencies, indices and other financial instruments. There are majorly two types of moving averages: Simple moving averages (SMAs) and exponential moving averages (EMAs). SMA takes the arithmetic mean of a specific period of past days. Meanwhile, EMA is a weighted average of the prices of recent days. Both indicators are useful to identify short-term and long-term opportunities. Moving Average Convergence Divergence MACD is another tool based on moving averages. The indicators help traders identify current market trends and momentum. Interpreting MACD is quite easy. It has two lines: MACD and signal. When the price moves above zero, and crosses the signal line in an upward direction, it suggests traders buy. Apply Now Meanwhile, when the price moves below zero and crosses the signal line in a downward direction, it suggests traders sell. Bollinger Bands FOLLOW US ON Bollinger Bands are used to determine overbought and oversold conditions that ultimately help you identify buying and selling opportunities. It contains three bands: Upper, lower and middle. When the middle band touches or moves above the upper band, it suggests traders buy. When the middle band touches or moves above the upper band, it suggests traders sell. Meanwhile, when the middle band touches or moves below the lower band, it suggests traders sell. In addition, the Bolinger band is also uses to determine market volatility. When the gap between bands is more, then it suggests significant volatility, and when the gap between bands is less, then it suggests less volatility. Tips for using the Buy-Sell indicator Indicators can help you in making your trading journey successful. However, it will only happen when you know the right way to interpret them. Here are some tips that help you efficiently use them: In-depth Study of Your Indicator Numerous indicators are there, however you don’t need to learn about all. Get a basic understanding of technical analysis and its key components like candlesticks, chart patterns, top indicators, support and resistance, trend lines, and many others. Once you have learned about technical analysis, get an in-depth understanding of the indicators you are using. Suppose you are using RSI and Bollinger Bands; then you need to read books or resources in order to learn to interpret them. You can even practice placing trades based on the indicator interpretation. It will help you understand whether you are using them in the right way or not. Never Use Multiple Indicators There is a mindset in the market that the more indicators you use, the more profit you will earn. But that’s only one of the trading myths. Using multiple indicators will make your chart messy. Too many indicators and lines will only increase the complexity, and the trader will end up making the wrong decision. Seek for Confirmation A trader should understand that indicator interpretation is subjective, and traders may generate false sell or buy signals. There is always a chance of wrong interpretation, especially when using signal indicators. Basically traders should neither use multiple indicators nor a single indicator. The best way to interpret the financial market is using a combination of two or three indicators. It will keep your chart clear, and traders can confirm their interpretation of one with the other. Also, select the indicators that complement each other, such as RSI and Bollinger Bands or moving averages, and support and resistance, oscillators, and average index. Stay aware of Market Conditions Indicators are good for technical analysis. However, traders should also consider the fundamental and sentimental analysis conditions. It includes events like trends, news, economic events, reports, announcements and speeches. In addition, keep a watch on the three most important factors that is volatility, liquidity and volume. If you are using an adequate buy-sell indicator, then you can track these factors even using it. Wrapping Up The trader mainly aims to identify the right buying and selling opportunities. There are many ways to do it, and the buy-sell indicator is amongst the best. By determining opportunities, traders can track the overall market conditions and increase overall profitability. However, many traders find using and interpreting indicators a complex process. But no need to worry at Carlos and Company; we provide valuable insights and indicators to traders. It will ultimately help them place trades and maximize their profit. Reach out to get daily indicator interpretation and market updates. LEAVE A REPLY Name (required) Email (required) Website Comment* Save my name, email, and website in this browser for the next time I comment. POST COMMENT WHO WE ARE? OUR POLICIES GET SUPPORT FOLLOW US AML Policy Terms and Conditions Carlos & Company is built on the Refund Policy Declaration foundation of trust, transparency, Privacy Policy FAQ'S faith, commitment, and dedicated Risk Disclosure Contact Us hard work. DISCLAIMER – Carlos & Company is not an investment advisor and can neither advise you on your financial goals nor can it access your risk profile. We are not providing financial and investment advice. We provide market knowledge and training through webinars and demo signal packages to educate the clients. We provide services for educational and training purposes. We take no responsibility whatsoever for money made or lost as a result of our signals or advice on Forex and Comex-related products we offer. Please consult a qualified investment advisor before subscribing to any of the trading packages. Copyright @ CNC LLC. All rights reserved. Automated page speed optimizations for fast site performance