Download
1 / 7
70 likes | 154 Views
Analyze travel times from Yonkers to various towns using ratios. Create tables and diagrams to calculate cumulative time. Solve distance-time equations and interpret results graphically. Solve scenarios involving distance and time relationships.

E N D
Lesson 14: From Ratio Tables, Equations, and Double Number Line Diagrams to Plots on the Coordinate Plane
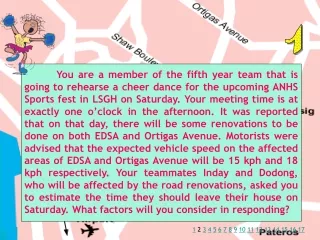
Exercise 1 Create a table to show the time it will take Kelli and her team to travel from Yonkers to each town listed in the schedule assuming that the ratio of the amount of time traveled to the distance traveled is the same for each city. Then extend the table to include the cumulative time it will take to reach each destination on the ride home.
Exercise 2 Create a double number line diagram to show the time it will take Kelli and her team to travel from Yonkers to each town listed on the schedule. Then, extend the double number line diagram to include the cumulative time it will take to reach each destination on the ride home. Represent the ratio of the distance traveled on the round trip to the amount of time taken with an equation. • 0 2 4 6 8 10 12 14 16 • 0 100 200 300 400 500 600 700 800 • Using the information from the double number line diagram, how many miles would be traveled in one hour? 50 miles • How do you know? If the train is moving at a constant speed, half of 2 is 1 and half of 100 is 50.
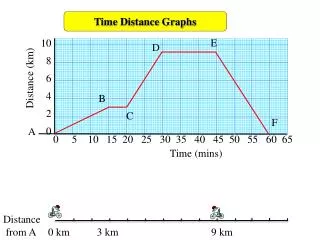
Example 1 Dinner service starts once the train is 250 miles away from Yonkers. What is the minimum time the team will have to wait before they can have their meal?
Problem Set Complete the table of values to find the following: • Find the number of cups of sugar needed if each pie Karrie makes, she has to use 3 cups of sugar.
Use a graph to represent the relationship of sugar for Karrie’s Pies • Title: Sugar for Karrie’s Pies • Sugar • (cups) • 18 • 15 12 9 • 6 • 3 • 0 1 2 3 4 5 6 • Pies
Create a double number line • Pie • 0 1 2 3 4 5 6 7 8 • 0 3 6 9 12 15 18 21 24