Download
1 / 62
620 likes | 769 Views
MiniBooNE n m and n m disappearance results Kendall Mahn Columbia University. Overview. Neutrino oscillation MiniBooNE experiment MiniBooNE-only neutrino disappearance analysis Antineutrino disappearance analysis Improvements to disappearance analysis Conclusion. Overview.

E N D
MiniBooNE nm and nm disappearance results Kendall Mahn Columbia University K. Mahn
Overview • Neutrino oscillation • MiniBooNE experiment • MiniBooNE-only neutrino disappearance analysis • Antineutrino disappearance analysis • Improvements to disappearance analysis • Conclusion K. Mahn
Overview • Neutrino oscillation • MiniBooNE experiment • MiniBooNE-only neutrino disappearance analysis • Antineutrino disappearance analysis • Improvements to disappearance analysis • Conclusion K. Mahn
Neutrino oscillation Neutrinos “oscillate” because the flavor state of the neutrino,na, is related to the mass states, ni, by a mixing matrix, Uai Since there are three observed flavors of neutrinos (ne, nm, nt), the mixing matrix, Uai, contains three mixing angles (q12,q23, q13) and a CP violating phase d. It can be factorized into three blocks, each corresponding to two neutrino mixing. cij= cosqij, sij= sinqij K. Mahn
Neutrino oscillation As the states propagate in time, the neutrino mass states interfere: The probability to observe nb with a pure na sample is: where L (km) is the distance traveled, E (GeV) is the energy of the neutrino and Dm2 (eV2) is the difference of the masses squared: Choice of L and E chooses what range of Dm2 the experiment is sensitive to, the size of the oscillations sets sin22q K. Mahn
Disappearance and Appearance experiments Starting with a na beam, there are two ways to look for oscillation: Appearance experiment Disappearance experiment Detect more nb than expected Detect less na than expected Neutrinos at energy E1 oscillate differently than at E2 for the same L, creating a unique signature for oscillation vs energy K. Mahn
Reducing errors with a second detector Adding a second detector measures the flux x cross section to the level of uncorrelated errors between the two detectors Start with 20% error Remove flux, cross section, and beam errors: 20%4% Add 5% uncorrelated errors: 4% + 5% = 6% K. Mahn
Normalization information To search for disappearance, can use normalization or shape information 1) Normalization information: Compare total number of events to expectation (aka “counting experiment”) K2K expected: 158 + 9.2 - 8.6 events at the far detector but observed: 112 events Normalization information provided by additional detectors Limited by statistics at far detector K. Mahn
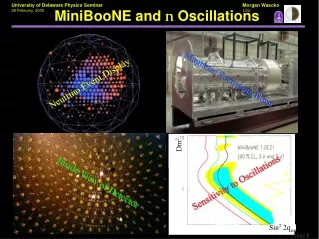
Shape information To search for disappearance, can use normalization or shape information 2) Shape information: Compare the energy distribution of events to no oscillation hypothesis • Ratio of oscillated events/ unoscillated events vs energy • Dm2 changes the periodicity of the oscillation (see Dm2=1eV2, Dm2=3 eV2) • sin22q changes the depth of the oscillation (see sin22q=1.0, sin22q=0.5) • MiniBooNE will make a one detector • shape measurement K. Mahn
Oscillation observations High Dm2 Plot of all oscillation experiments: “Atmospheric”: Dm223~10-3eV2, sin22q23 ~45° With atmospheric n: SuperK With Accelerator n: MINOS “Solar”: Dm212 ~10-5eV2, sin22q12 ~32° With solar n: SNO With reactor n: KamLAND “High Dm2”: Dm2~1-10eV2 CDHS (disappearance) CCFR (disappearance) LSND (appearance) Atmospheric Solar K. Mahn
High Dm2 disappearance expts CCFR (FNAL E701) I.E. Stockdale et al Z.Phys.C27:53,1985 • Mono energetic meson beam produces dichromatic (~50, 160GeV) neutrino beam • Two steel/scintillator detectors at 715m and 1116m • CDHS at CERN • F. Dydak et al. Phys.Lett.B134:281,1984. • 19.2 GeV protons on Be target produces ~3GeV neutrino beam • Two iron/scintillator detectors at 130m and 885m 90% CL excluded region CCFR 90% CL excluded region CDHS K. Mahn
LSND ne appearance LSND experiment Observation of 3.8 s excess of ne in nm beam Karmen, Bugey and MiniBooNE exclude the LSND parameter space If ne oscillate but ne do not, then exotic physics is needed to explain this signal K. Mahn
Sterile neutrinos One explanation for the LSND oscillation signal is to add another “sterile” flavor of neutrino (or 2 or N) to the mixing matrix: Adding 1 sterile neutrino is 3+1, adding N is 3+N Disappearance expts (CDHS/CCFR/atmospheric) disfavor 3+1 already Maltoni, Schwetz, Valle, Phys.Lett.B518:252-260,2001. hep-ph/0107150 3+2 models have large mixing and prefer the region where experimental limits are weakest G. Karagiorgi et al, Phys.Rev.D75:013011,2007. hep-ph/0609177 K. Mahn
Motivation for neutrino disappearance The observation of nm disappearance could imply: - sterile neutrinos G. Karagiorgi et al, Phys.Rev.D75:013011,2007. hep-ph/0609177 - neutrino decay Palomares-Ruiz, Pascoli, Schwetz, JHEP 0509:048,2005. hep-ph/0505216 - extra dimensions Pas, Pakvasa, Weiler, Phys.Rev.D72:095017,2005. hep-ph/0504096 The lack of nm disappearance also can constrain these models When the path-length increases for active neutrinos in the bulk relative to sterile neutrinos, oscillations between sterile and active flavors are enhanced above a resonant energy, and suppressed below A resonance energy between 30-400MeV explains all data in a 3+1 model Resonant E~40MeV K. Mahn
Motivation for neutrino disappearance The combination of nm and nm disappearance tests unitarity of the mixing matrix, and CPT • Ifnm disappear, but nm do not would signal CPT violation • Sterile neutrino models (3+1 or 3+2) can be CPT violating Barger, Marfatia, & Whisnant, Phys. Lett. B576 (2003) 303 • Introduction of a new light gauge boson Nelson, Walsh Phys .Rev. D77 033001 (2008) hep-ph/0711.1363 • Lorentz violation Katori, Kostelecky, & Tayloe, Phys. Rev. D74 (2006) 1050009 P. Adamson et al, Phys. Rev. Lett. 101 151601 (2008) hep-ex/0806.4945 K. Mahn
Motivation for neutrino disappearance • The observation of nm disappearance could imply new physics • The lack of nm disappearance constrains new physics models • The combination of nm and nm disappearance tests unitarity and CPT Can MiniBooNE add to the current disappearance limits? YES! with both neutrinos and antineutrinos K. Mahn
Overview • Neutrino oscillation • MiniBooNE experiment • MiniBooNE-only neutrino disappearance analysis • Antineutrino disappearance analysis • Improvements to disappearance analysis • Conclusion K. Mahn
The MiniBooNE Collaboration Y.Liu, D.Perevalov, I.Stancu University of Alabama S.Koutsoliotas Bucknell University E.Hawker, R.A.Johnson, J.L.RaafUniversity of Cincinnati T. L. Hart, R.H.Nelson, M.Tzanov M.Wilking, E.D.Zimmerman University of Colorado A.A.Aguilar-Arevalo, L.Bugel, L.Coney, Z. Djurcic, K.B.M.Mahn, J.Monroe, D.Schmitz M.H.Shaevitz, M.Sorel Columbia University D.Smith Embry Riddle Aeronautical University L.Bartoszek, C.Bhat, S.J.Brice B.C.Brown, D. A. Finley, R.Ford, F.G.Garcia, C. Green, P.Kasper, T.Kobilarciik, I.Kourbanis, A.Malensek, W.Marsh, P.Martin, F.Mills, C.D.Moore, E.Prebys, A.D.Russell , P.Spentzouris, R.J.Stefanski, T. WilliamsFermi National Accelerator Laboratory D.C.Cox, T.Katori, H.Meyer, C.C.Polly, R.Tayloe Indiana University H.Ray, B. Osmanov University of Florida G.T.Garvey, A.Green, C.Green, W.C.Louis, G.McGregor, G.B.Mills, V.Sandberg, R.Schirato, R.Van de Water , D.H.White, G.P.ZellerLos Alamos National Laboratory Collaboration may be larger than it appears R.Imlay, J.A. Nowak, W.Metcalf, S.Ouedraogo, M. Sung, M.O.Wascko Louisiana State University J.M.Conrad, G. Karagiorgi, V. Nguyen Massachusetts Institute of Technology J.Cao, Y.Liu, B.P.Roe, H.J.YangUniversity of Michigan A.O.Bazarko, E. M. Laird, P.D.Meyers, R.B.Patterson, F.C.Shoemaker, H.A.TanakaPrinceton University P.Nienaber Saint Mary's University of Minnesota J. M. Link Virginia Polytechnic Institute C.E Anderson, A.Curioni, B.T.Fleming,S.K. Linden, M. Soderberg Yale University K. Mahn
MiniBooNE Experiment Short baseline (L=~500m) designed to test LSND-like ne appearance 8.9 GeV/c protons on Be produce mesons which decay to neutrinos or antineutrinos Changing the polarity of the horn focuses positive(negative) mesons and produces a neutrino(antineutrino) beam Data sets shown today are: 5.579e20POT neutrino mode (190,454 events) 3.386e20POT antineutrino mode (27,053 events) K. Mahn
MiniBooNE Experiment Short baseline (L=~500m) designed to test LSND-like ne appearance 8.9 GeV/c protons on Be produce mesons which decay to neutrinos or antineutrinos In 2007, the SciBooNE detectors were put into the beamline at 100m SciBooNE K. Mahn
Beamline Timeline 2/03 - 1/06: First results data run, neutrino mode 1/06-10/07: First antineutrino run period 5/29/07: SciBooNE begins data taking 10/07-4/08: Joint neutrino run with SciBooNE 4/08-now: Joint antineutrino run with SciBooNE 8/08: SciBooNE decommissioned In MiniBooNE:~1 n per 1e15 POT ~ 0.2 n per 1e15 POT In SciBooNE: ~5x closer, ~50x smaller ~0.5 n per 1e15 POT ~ 0.1 n per 1e15 POT Thank you Accelerator division! from SciBooNE & MiniBooNE K. Mahn
MiniBooNE Detector The MiniBooNE detector is a ~1kton mineral oil Cherenkov detector 12 m diameter, 1280 inner PMTs, 240 outer ‘veto’ PMTs Use hit topology and timing to determine electron-like or muon-like Cherenkov rings and corresponding charged current neutrino interactions ne e- W+ nm m- W+ K. Mahn
MiniBooNE ne appearance results • ne sample is consistent with expectation >475 MeV (0.6 s excess) • 3.0 s excess at low energy (200-475 MeV) Initial observation confirmed with later work (Aug 1st W&C) Excess cannot be described based on a simple 2 n mixing hypothesis PRL forthcoming • This result assumes nonmdisappearance K. Mahn
Overview • Neutrino oscillation • MiniBooNE experiment • MiniBooNE-only neutrino disappearance analysis • Antineutrino disappearance analysis • Improvements to disappearance analysis • Conclusion K. Mahn
nm disappearance analysis plan To do a nmdisappearance analysis with one detector, we need: Event selection + Prediction with systematic errors flux, cross section, detector effects + Disappearance fit machinery K. Mahn
nmdisappearance sample CCQE nm m- nm W+ • Use Charged Current Quasi elastic events (CCQE) nm events • Selecting on muon selects nm • With just muon’s energy, angle, can reconstruct neutrino energy p n m nm e 12C n Tag single muon events and their decay electron • 2 subevents (m, then e) with minimal veto activity in both • muon-like track, 2nd event below decay electron energy endpoint • both events within fiducial volume p “Selecting muons in a Cherenkov detector is like shooting fish in a barrel” - Aunt Edith K. Mahn
CCQE nm selection • Impressive neutrino sample: ~200k events, 74% CCQE purity • Background is CCp+where the pion is absorbed in the nucleus or detector • All events can oscillate, but misreconstruction of CCp+ as CCQE events mean CCp+ are shifted to low EnQE • Pure neutrino sample, only 1.4% antineutrino content CCp+ nm CCQE nm m- m- nm nm W+ W+ p+ p n n p K. Mahn
nm disappearance analysis plan To do a nm disappearance analysis with one detector, we need: Event selection + Prediction with systematic errors flux, cross section, detector effects + Disappearance fit machinery K. Mahn
Flux prediction Neutrino beamline is modeled in Geant4hep-ex/0806.1449 p + Be target meson production focusing decay neutrinos Included as systematic error: Beam optics and targeting efficiency p+Be elastic and inelastic cross sections Production of mesons (p+/-, K+/-) from pBe interactions Horn magnetic field Largest sources of error are meson production and horn magnetic field
Meson Production Uncertainties ds/dpdW (mb c/[GeV sr]) The HARP experiment measured p+Be p+/ p-(hep-ex/0702024) Use the HARP data and errors to produce different fluxes consistent with HARP Propagate the new fluxes through to the neutrino spectrum and look at the effect on the CCQE nm sample 88% of the CCQE nm sample is within HARP’s coverage; 99% is contained within HARP and qp > 0.210 p pi pp (GeV) HARP data with errors in qp bins MiniBooNE flux parameterization
Cross section model and the disappearance result For ne appearance result, we tuned the cross section model Shape only fit in Q2 using the CCQE nm sample favored a higher axial form factor (MA) and a new nuclear effect parameter, K, was introduced to model Pauli suppression or other effects at low Q2 Phys. Rev. Lett. 100, 032301 (2008). MA = 1.23 +/- 0.20 GeV K = 1.019 +/- 0.011
Cross section model and the disappearance result For nm disappearance, we undo the tuning and set the uncertainties to cover the excursion in the world data and our own World’s data on deuterium: MA=1.014 +/- 0.014 GeV Bodek et al J.Phys.Conf.Ser.110:082004,2008. hep-ex/0709.3538 K2K CCQE s on Carbon: MA = 1.14+/- 0.11 GeV F. Sanchez, NuInt07 K2K CCQE s on Oxygen MA = 1.20+/- 0.12 GeV R. Gran et al., PRD74, 052002 (2006) Using: MA=1.0 +/-0.23 GeV, K=1.000+/- 0.0220 The cross section uncertainties also include uncertainties on the CCp+ cross section and pion charge exchange and absorption in the nucleus
Can the cross section model mask disappearance? (MA=1.2 GeV,K=1.02) / (MA =1.0 GeV, K=1.0) induces a shape change similar to Dm2=0.5 eV2 in EnQE But in Q2, oscillations vanish while the effect of the cross sections is stronger Preliminary Preliminary Q2 (GeV2) EnQE (GeV)
Detector uncertainties Muon hodoscope tracked incoming (10kHz) cosmic ray muons entering detector Events which stopped in scintillation cubes provided known distance with which to calibrate muon energy in oil Muon kinetic energy resolution is 7% at 300MeV Angular resolution is 5°
Systematic error summary • Data = 190,454 events • MC (MA,K=1.0) = 145,085 +/- 20% • The more one under predicts the data, the stronger the sensitivity to nm disappearance becomes • We under predict the data normalization by 1.5 s • In order to be conservative, we choose to perform a shape only disappearance fit • Normalization information will be included with SciBooNE
nm disappearance analysis plan To do a nm disappearance analysis with one detector, we need: Event selection + Prediction with systematic errors flux, cross section, detector effects + Disappearance fit machinery K. Mahn
Shape-only disappearance fit Use Shape only Pearson’s c2: For each point in oscillation space compare the prediction, pi(Dm2, sin2q), to the data, di, and sum over bins i and j • Mij is shape only (variations conserve events across all bins) • X(Dm2, sin2q) renormalizes pi to the total data events, For Dm2, sin2q points where c2 > c2 (CL), draw that CL curve For 16 bins, c2(90% CL) = 23.5
Sensitivity The sensitivity is a fit to fake data which exactly agrees with prediction but all statistical and systematic uncertainties are included A shape-only, single detector measurement is sensitive to nm disappearance in the particular region favored by 3+2 models Preliminary shape-only sensitivity for 90%CL,3s and 5s K. Mahn
Cross check: Frequentist Dc2 Comparison between data (di) and prediction (pi) relative to best fit across all Dm2, sin2q points For each point, create 50 “fake experiments” using fluctuations consistent with the errors and calculate Dc2 (Dm2, sin2q, CL) For fit to real data, use Dc2 (Dm2, sin2q, CL) to generate CL curves Fit data at each point as if it corresponds to that true point, calculate Dc2 if Dc2 > Dc2 (Dm2, sin2q, CL) for a given CL, draw curve Procedure can be done with shape-only fits like Pearson’s c2 Renormalize pi at each point, matrix is shape only K. Mahn
Cross check: Frequentist Dc2 Frequentist Dc2 gives better sensitivity by mapping out distorted Dc2 surface but is computing intensive • Dc2 ranges from ~4 degrees of freedom (dof) at low sin2q to 1dof at high sin2q • Approximately 1 hour of computing for each Dc2 point shown, as compared to the ~1 minute needed for the Pearson’s c2 limit Shape-only Pearson’s c2 limit to a mock data set Dc2 limit to the same mock data set K. Mahn
Chi2 Why does the limit look weird? For all fits, the sensitivity curve can shift rapidly across sin2q We have been calling them “wiggles” Wiggles are less pronounced in the sensitivity, but are present for any fake or real data fit Shape-only Pearson’s c2 limit to a mock data set Dc2 limit to the same mock data set K. Mahn
What are the wiggles? Chi2 For a fixed sin2q, Dm2 close in value do not have similar behavior in EnQE For sin2q=0.1, if we compare the shape of Dm2=2 eV2to Dm2=3 eV2 we see that the c2(Dm2=2) < c2(Dm2=3) The c2 changes with Dm2; a flat cut on c2 creates wiggles This problem is exacerbated for data fluctuations and can occur for any error envelope Preliminary EnQE (GeV) K. Mahn
What are the wiggles? Chi2 This effect shows up in previous disappearance results even when there is a second detector A second detector makes it harder to match L/E across all L, E but anytime it can, the c2 will be lower than nearby Dm2 CDHS, linear scale, two detectors Bugey, log scale, two positions, 1 detector CCFR, linear scale, two detectors K. Mahn
nm disappearance analysis plan To do a nm disappearance analysis with one detector, we need: Event selection + Prediction with systematic errors flux, cross section, detector effects + Disappearance fit machinery = Candy! er, Results! K. Mahn
Data and null oscillation prediction Data (5.579e20POT,statistical errors shown) with null oscillation prediction (normalized to total data) vs EnQE Errors shown are diagonal elements of the shape-only error matrix c2(null) =17.78 (34% for 16 bins) Systematics dominate: c2(null, statistics only)=665 Preliminary K. Mahn
Neutrino disappearance limit 5.579E20 POT data set limit for 90%CL,3s and 5s c2 (null) =17.78 (34%,16 bins) c2 (min) =12.72 (69%, 16bins) at Dm2=17.5eV2,sin2q=0.16 Preliminary MiniBooNE observes no neutrino disappearance K. Mahn
Neutrino disappearance limit PRELIMINARY PRELIMINARY Preliminary sensitivity for 90%CL,3s5s data limit for 90%CL,3s5s K. Mahn
Overview • Neutrino oscillation • MiniBooNE experiment • MiniBooNE-only neutrino disappearance analysis • Antineutrino disappearance analysis • Improvements to disappearance analysis • Conclusion K. Mahn
Antineutrino CCQE sample • Ability to change polarity of horn allows us to focus negative mesons and produce an antineutrino beam • Apply same CCQE selection cuts, same error analysis, same fit machinery • Main difference:Substantial neutrino events in the antineutrino sample (25%) PRELIMINARY K. Mahn
Neutrinos in antineutrino sample Is there a shape difference between the neutrino background and the antineutrino signal? The neutrino and antineutrino spectrums are quite similar If we change the normalization of the antineutrinos (Np-) differently from the neutrinos (Np+), the effect on the shape of the antineutrino sample is less than the size of the statistical errors Ratio of Np+=0.8, Np-=1.2 to Np+/-=1.0 vs EnQE K. Mahn


![Force [N/m]](https://cdn2.slideserve.com/4557374/slide1-dt.jpg)