Download
1 / 51
510 likes | 534 Views
Team Scalar and Momentum Advection. Assignment #1 10.08.2010. Kirstin Gleicher , Michelle Pitcel, and Andrew Rosenow. Simulation Differences. Used Milbrandt microphysics scheme Altered momentum and scalar advection closure order Control Run Momentum was 5 th order

E N D
Team Scalar and Momentum Advection Assignment #1 10.08.2010 Kirstin Gleicher, Michelle Pitcel, and Andrew Rosenow
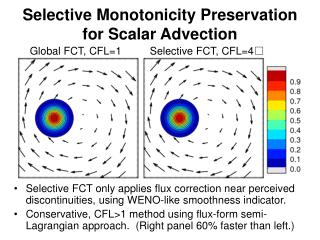
Simulation Differences • Used Milbrandt microphysics scheme • Altered momentum and scalar advectionclosure order • Control Run • Momentum was 5th order • Scalar was 3rd order • Experimental Run • Momentum was 4th order • Scalar was 2nd order
Mesocyclone Tracking Algorithm Δx • Looks for the first time with precipitation (reflectivity) • Finds the maximum column-average vorticity • Searches for the next vorticity maximum in two moving domains-one for each post-split supercell • Δx, Δy = 10 km Left Mover Domain Δy Previous meso location Right Mover Domain Δy Δx
Reflectivity Images Experiment Run Control Run
Reflectivity Images Experiment Run Control Run
Reflectivity Images Experiment Run Control Run
Reflectivity Images Experiment Run Control Run
Reflectivity Images Experiment Run Control Run
Reflectivity Images Experiment Run Control Run
Reflectivity Images Experiment Run Control Run
Reflectivity Images Experiment Run Control Run
Reflectivity Images Experiment Run Control Run
Reflectivity Images Experiment Run Control Run
Reflectivity Images Experiment Run Control Run
Reflectivity Images Experiment Run Control Run
Reflectivity Images Experiment Run Control Run
Reflectivity Images Experiment Run Control Run
Reflectivity Images Experiment Run Control Run
Reflectivity Images Experiment Run Control Run
Reflectivity Images Experiment Run Control Run
Reflectivity Images Experiment Run Control Run
Reflectivity Images Experiment Run Control Run
Reflectivity Images Experiment Run Control Run
Reflectivity Images Experiment Run Control Run
Reflectivity Images Experiment Run Control Run
Reflectivity Images Experiment Run Control Run
Reflectivity Images Experiment Run Control Run
Reflectivity Images Experiment Run Control Run
Reflectivity Images Experiment Run Control Run
Reflectivity Images Experiment Run Control Run
Reflectivity Images Experiment Run Control Run
Reflectivity Images Experiment Run Control Run
Reflectivity Images Experiment Run Control Run
Reflectivity Images Experiment Run Control Run
Reflectivity Images Experiment Run Control Run
Reflectivity Images Experiment Run Control Run
Reflectivity Images Experiment Run Control Run
Reflectivity Images Experiment Run Control Run
Advection Red = Experimental Blue = Control S-1 S-1 Time Step Time Step
Divergence Red = Experimental Blue = Control S-1 S-1 Time Step Time Step
Stretching Red = Experimental Blue = Control S-1 S-1 Time Step Time Step
Solenoidal Red = Experimental Blue = Control S-1 S-1 Time Step Time Step
Vorticity Tendency Comparison of Maximum in Total Vorticity Tendency at 1km Red = Experimental Blue = Control Comparison of Maximum in Total Vorticity Tendency at 10km Comparison of Maximum in Total Vorticity Tendency at 5km S-1 S-1 Time Step Time Step