Download
1 / 30
300 likes | 326 Views
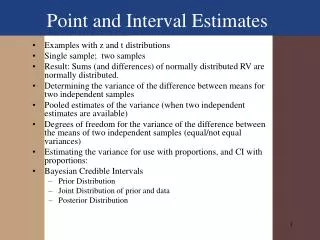
Learn about point estimates in statistics, including population vs. sample, parameter vs. statistic, unbiased estimates, confidence intervals, and calculation methods with practical examples.

E N D
Remember….. • Population • It is the set of all objects being studied • Sample • It is a subset of the population
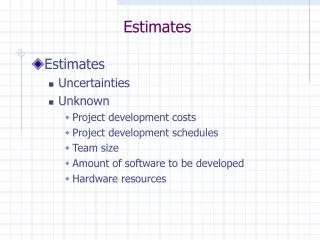
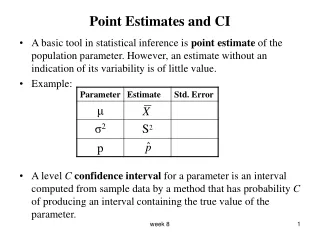
Parameter • Quantity computed from values in a population • Usually not known
Statistic • Quantity computed from values in a sample. • Computed directly from sample data
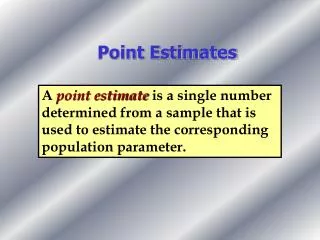
Point Estimate • It is a single number that is based on sample data that represents a plausible value of the characteristic for the population. • It’s the statistic (from a sample) that we use to estimate the parameter (of the population).
Examples • To find a point estimate of the average height of students in this class I could use a sample of 10 people and find their average height. • To find the percent of green M&M’s in a bag, I could use 20 bags and find the average percent in those bags to estimate the true population proportion.
An article on affirmative action reported that 537 of the 1013 people surveyed believed that affirmative action programs should be continued. Find a point estimate of the population proportion.
Calories per ½ cup serving for 16 popular chocolate ice cream is shown below. Find a point estimate for the number of calories in a serving of chocolate ice cream.
Calories per ½ cup serving for 16 popular chocolate ice cream is shown below. Find a point estimate for the number of calories in a serving of chocolate ice cream. We could use the mean: median:
Calories per ½ cup serving for 16 popular chocolate ice cream is shown below. Find a point estimate for the proportion that are greater than 190.
We tend to pick an estimate that yields an accurate estimate. • To estimate a proportion – we use a proportion (not a mean). • To estimate how many – we use the mean, median, or trimmed mean • To estimate variation – we use standard deviation, variance, or range
For our class (the population), find a point estimate for the … • Average height • Difference between height of girls & height of the boys • Proportion with brown eyes
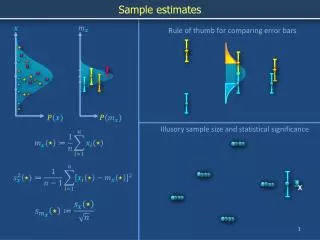
Unbiased Statistic • It’s a statistic whose mean value is equal to the value of the population being estimated. • Biased – not equal to the population being estimated.
Examples of unbiased estimators • mean: median trimmed mean • Proportion: • Variance:
Biased: Range • If using a sample – it will only equal the population if you have the lowest & highest values. The probability for this to happen is very small – almost 0. • Thus it’s biased because for most, the sample range is smaller than the population range.
Airborne Times: 57, 54, 55, 51, 56, 48, 52, 51, 59, 59. Find point estimate of mean & variance. • Put them in list 1 • Do 1-var Stat • To get the variance, you must take the st. dev. (Sx) and square it.
Confidence Interval Proportions
Remember • Point estimate is different every time since it depends on the sample selected. • In choosing a confidence interval, it is not a single point but rather an interval of reasonable values.
Confidence Interval • Interval of reasonable values for the characteristic chosen with a degree of confidence. • The value of the population characteristic will likely be between the upper and lower bounds.
Confidence Level • This represents the success rate of the method used to construct the interval. • If I repeat the process over & over, approximately this % of the intervals will contain the true parameter.
So, if I want to be 95% confident that my interval contains the true proportion, how many deviations would I be from the mean proportion?
So what’s the critical z value that corresponds to a 98% confidence.
PANIC! • P – Parameter (tell what we are estimating) • A – Assumptions • N – Name the Formula • I – Interval (calculate it) • C - Conclusion
When 320 college students were surveyed, 125 said they own their car. Construct a 90% confidence interval for the proportion of college students who own their car.
A survey of 100 fatal accidents showed that 52 were alcohol related. Construct a 98% confidence interval for the proportion of fatal accidents that were alcohol related.
Explain what the 90% confidence level means. If I repeat this process over & over, 90% of the intervals found will contain the true population proportion of households that own at least one gun.
What happens to the width of the interval if we go from 90% confidence to 98% confidence?What happens to the width of the interval is we increase the sample size?
Homework • Worksheet