Download

1 / 14
140 likes | 266 Views
Sea Ice Concentration Retrieval from Passive Microwave Data for Polar Regions. Geog. Sc. 880 A Review by Raghavendra S. Mupparthy. Introduction. The mapping of sea ice concentration in the polar regions is very important for Global climate change research

E N D
Sea Ice Concentration Retrieval from Passive Microwave Data for Polar Regions Geog. Sc. 880 A Review by Raghavendra S. Mupparthy
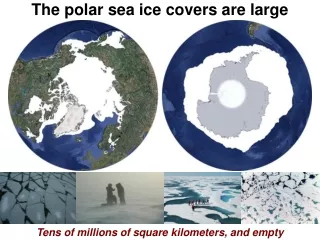
Introduction • The mapping of sea ice concentration in the polar regions is very important for • Global climate change research • The study of specific sea ice phenomena such as polynyas • Increasing need for real-time navigation support for polar oceanographic expeditions. • Resolution Issues • The best spatial resolution is available from the visible to middle infra red sensors such as AVHRR and OLS (Operational Linescan Systems) aboard the NOAA and DMSP spacecraft respectively. However these sensors are affected by cloud cover. • Ideally the best data would be Synthetic Aperture Radar (SAR). But the temporal and spatial coverage is still an issue at higher latitudes (Lubin et al., 1997). • Hence passive microwave remote sensing utilizing 19 and 37 GHz SSM/I are the best available options (Zwally et al., (1983); Cavalieri et al., 1984).
Brief History Of Passive Microwave Remote Sensing Sensors and Data • Data from the passive microwave radiometers have been available since the launch of NIMBUS-5 electrically scanning microwave radiometer (ESMR) in December 1972. ESMR was a single channel horizontally polarized 19-GHz radiometer. This sensor was operational till early 1977. • The scanning multichannel microwave radiometer (SMMR) was launched onboard the SEASAT and NIMBUS-7 satellites in October 1978. Both these radiometers provided horizontally and vertically polarized data at 6.6, 10.7, 18, 21, 37 GHz. The SEASAT SMMR functioned only for 3 months and the NIMBUS-7 SMMR was operational till August 1987. • SMMR data from NIMBUS-7 has been resampled to 1 degree x 1 degree by DAAC. • Since 1987, the special sensor microwave imager (SSM/I) has been providing data onboard the defense military satellite program, DMSP F8, F11, and F13 satellites. The SSM/I provides dual polarized data at 19, 37 and 85 GHz and vertically polarized data at 22 GHz. The five lower channels (19H, 19V, 22V, 37H, and 37V) are sampled on an approximately 25 km grid along the scan and along the track. The two 85.5 GHz channels are sampled at 12.5 km both across and along the track. • With more than 30 years of data from earth observation in microwave region, this dataset is very crucial for climate change studies. Hence the conversion of raw data into geophysical products should be done as accurately as possible.
Background and Past studies • The two major types of sea ice that are known to have distinctly different microwave emissivities are: • first-year ice (ice that is at least 30 cm thick but not undergone a melt season) • multiyear ice (ice that has survived at least one melt season). • Also new and young ice (under 30 cm thick) are known to have distinctly different microwave emissivities from first-year ice. However, the presence of these additional ice types within the sensor field of view cannot be determined unambiguously and thus contributes to the error of the calculated ice concentration. (http://daac.gsfc.nasa.gov/CAMPAIGN_DOCS/FTP_SITE/INT_DIS/readmes/ice.html#201) • Most algorithms retrieve sea ice concentrations based on two simple equations: • fW + fMY + fFY = 1 (1) • TB = fWTwB + fMYTMYB + fFYTFYB (2) • Where fW, fMY, and fFY are the amount of open water, multi-year and first-year ice respectively. TB is the brightness temperature and TwB,TMYB, and TFYB are the brightness temperatures from open water , multi-year and first-year ice, respectively. • Zwally et al., (1983) derived sea ice concentrations for Antarctica by using the radiative transfer equation and a simple mixing algorithm that assumes that the surface is either covered or not covered by sea ice.
Background and Past studies (Contd.,) • The basic assumptions made in Zwally et al., (1983) study were: • that there is only one radiometrically distinct type of sea ice. • For a given ice temperature, the brightness temperature changes linearly with ice concentration. • Parkinson et al., (1987) developed an expanded formulation of the ice concentration, as the original formulation was not appropriate for central Antarctica. The ice concentrations were presented along with a LUT for different ratios of first year and multiyear ice fractions. • Other major algorithms for calculating ice concentrations are: • NORSEX algorithm proposed by Svendsen et al., 1983. In order to estimate concentration, satellite measured brightness temperatures have to be transformed to give an effective brightness temperature at the surface. This model uses 19V and 37V. • AES algorithm proposed by Swift et al., 1985. Again the measured brightness temperatures have to be linearly transformed to ground emissivities. This model uses 37V and 19H. • Comiso algorithm developed by Comiso, 1986. This algorithm works directly on satellite measured brightness temperatures. When this model uses 37V and 37H channels, then this model is also called COMPOL. When 37V and 19V channels are used, then it is called frequency based Comiso algorithm or COMFREQ.
Background and Past studies (Contd.,) • NASA Team algorithm was developed by Gloersen and Cavalieri in 1986. This model uses the satellite data at channels 37V, 19V and 19H to calculate two ratios: the polarization ratio (PR) and the spectral ratio (GR). • Bootstrap algorithm was developed by Comiso 1995 and is a combination of COMPOL (HV37) and COMFREQ (V1937). • Basic Idea of this presentation • The basic idea of today’s presentation is: • Review of the paper: • Comiso, J.C, Cavalieri D. J, Parkinson C.L, and Gloersen P., Passive microwave algorithms for sea ice concentrations: A comparison of two techniques, Remote sensing of Environment, Vol. 60. 1997. • Application of the selected algorithms from the above paper: • NASA Team algorithm • Bootstrap algorithm • to Jan 2002 F13 - SSM/I data from Homework #5 for estimating sea ice concentrations in the Northern Hemisphere.
Algorithm description • NASA Team Algorithm: The NASA Team multichannel algorithm was originally developed to be used with Nimbus-7 SMMR radiances, but has subsequently been modified to be used with the DMSP SSM/I radiances as well (Cavalieri et al., 1991). This section will focus on SSM/I version. The observed brightness temperature (TB) is expressed as the sum of contribution from three dominant ocean surface types – ice-free ocean and two types of ice, type A and B: TB = TBW.CW + TB1A.C1A + TB1B.C1B where this relation is same as Eq(2), except that instead of fractions, we are using concentrations and the two types of ice are identified as first-year (FY) and multi-year (MY) ice for the Northern Hemisphere. In the Southern Hemisphere, these are defined as “two radiometrically distinct” ice types, rather than FY and MY. This is because of the absence of supporting data from concurrent surface and airborne observations, to provide physical description of these two types, so the A and B nomenclature remains. The physical basis for distinguishing the three ocean surface types, open water, ice-A and ice-B is Figure-1. The difference between 19V and 19H is used to identify open water from sea ice. The contrast between FY and MY ice (or type A and B) is greater at 37 GHz and 19GHz. The algorithm parameterizes these two characteristics through two radiance ratios that are used as independent variables, called polarization (PR) and the spectral gradient ratio (GR).
Figure 1. Adapted from the review paper - Comiso et al., (1997) Algorithm description (Contd.,) These ratios are defined as: PR = [TB(19V)-TB(19H)] / [TB(19V)+TB(19H) … (3) GR = [TB(37V)-TB(19V)] / [TB(37V)+TB(19V)] … (4) where TB(19V) is the brightness temperature at 19 GHz vertical polarization. C1A = (a0 + a1PR + a2GR + a3PR * GR)/D ... (5) C1B = (b0 + b1PR + b2GR + b3PR * GR)/D … (6) where D = c0 + c1PR + C2GR + c3PR * GR … (7) C1A≡ CFY and C1B ≡ CMY The total concentration, CT is the sum of FY and MY concentrations.
Algorithm description (Contd.,) The coefficients ai, bi, and ci (i = 0, 3) are functions of a set of nine TBs. These TBs, referred to as algorithm tie points, are observed SSM/I radiances over areas of known ice-free ocean, first-year (FY) sea ice or type A, and multiyear (MY) ice or type B, for each of the three SSM/I channels. These are shown in Table 1. PR v/s GR plots define the vertices of a non linear triangle that are representations of the algorithm in the PR-GR space. These plots are shown in Figure 2a and 2b. The ice tie-point selections were made by Comiso et al., (1997) using concurrent underflights for different seasons in the Beaufort Sea. First year and multiyear ice tie-pints were selected from areas in the Beaufort Sea (120°W – 150°W), whereas the open ocean tie points were selected in the Norwegian Sea (0° – 30°E). Weather filters were implemented to eliminate spurious sea ice concentrations in open ocean as: GR(37/19) = 0 if GR(37/19) > 0.05 GR(22/19) = 0 if GR(22/19) > 0.045 Table 1. Coefficients derived from tie points. (adapted from the review paper)
Algorithm description (Contd.,) Figure 2a: (Left) Spectral gradient ratio versus polarization ratio for (a) north polar region and (b) south polar region. The curved triangle is a representation of the NASA team algorithm used to calculate sea ice concentration and type. Figure 2b: (Right) GR v/s PR plot using F13 SSM/I data for Jan 2002. This is again for the north pole region, where the similarities between Fig 2a (top) and 2b are clear.
Algorithm description • The Bootstrap Algorithm: The Bootstrap technique is based on the distributions of multichannel clusters of brightness temperatures of sea ice. An inherent assumption in this algorithm is: • There are large regions in the central Arctic in winter with 100% sea ice concentrations. The Bootstrap algorithm takes advantage of the fact that, in the scatter plot of 37H and 37V, the data points for Arctic are highly correlated. Also in the seasonal regions, where first-year ice dominates, as in Antarctic, Comiso et al., 1984; and 1997 found that the vertically polarized 19- (or 18-) and 37-GHz channels were the most consistent with the ship and helicopter observations. Hence V1937 was used for Antarctica and for Arctic, ice concentrations greater than 90 % use HV37 data channels and V1937 for rest of the region. In summary, the datasets used in this algorithm by Comiso et al., 1997 are: • 37H and 37V channels, called HV37 set. • 19V and 37V channels, called V1937 set. The ice concentration, C for any set si given as: C = {[(T1B – T1O)2 + (T2B – T2O)2] / [(T2i – T2O)2 + (T1i – T1O)2]}1/2 … (8) where T1B, T1O, and T1i are the observed brightness temperature, reference brightness temperature for open ocean and sea ice respectively for channel #1 in the selected set.
Basic Differences between the two techniques: The Key difference between the two techniques are: • The different choice and utilization of the sensor channels, • Different reference brightness temperatures, • Different sensitivities to changes in physical temperature • Different weather filters • Seasonal adjustment of Bootstrap tie points. Algorithm description (Contd.,) These temperature include contributions from the intervening atmosphere. The brightness temperatures in some open ocean areas yield nonzero ice concentrations. Such areas are masked through a thresholding technique that utilizes the 19-GHz and 22-GHz channels. In this scheme, when the difference in brightness temperatures between 19 and 22 GHz is greater than the threshold, Mo (> 16 K for winter and >23 K for summer), the data are set to 0% concentration. The actual ice concentration gradient near the ice edge may be higher than is exhibited by the data. This is partly because of changes in emissivity from the ice edge (where there is an abundance of new ice) to the inner pack and partly because of the antenna pattern of the sensor, which tends to smear the data when the satellite passes a boundary of two contrasting surfaces.
Basic Differences between the two techniques: (Contd.,) Both algorithms use the 19V and 37V channels, but the Team algorithm complements these channels with the 19H channel, whereas the Bootstrap algorithm complements with 37H channel. And both the algorithms use 22-GHz as a weather filter, but use different thresholds and channels for this mask, causing a slight difference in the location of the marginal sea ice region. Two ratios defined by using the three channels are utilized by the Team algorithm, whereas the Bootstrap technique uses two channels at a time, with the 37V and 37H combination used only in the high ice concentration regions of the Arctic. • Sensitivity to Ice temperature changes In the Team algorithm, spatial and temporal variations in the ice temperature are taken into account to the first order through the use of ratios of brightness temperatures. With the PR, the emissivities cancel out, but for GR, the situation is different because of different penetration depths at 19 GHz and 37 GHz. Comiso et al., 1997 has indicated that temperature of the freeboard of the multiyear ice (which depends on ice thickness and snow cover) varies by as much as 5K from top to bottom. Nevertheless, Its been reported that in most cases, the effect of temperature on the GR is small. In the Bootstrap, the use of the HV37 set of channels (for concentrations > 90%) helps to reduce the error due to spatial changes in the snow/ice interface temperatures in the retrieval of ice concentrations. Thus when using HV37 set, the changes in physical temperature cause almost equal changes in the brightness temperatures for both the polarized components. But in Antarctic the error in ice concentration is about 0.9% per Kelvin change in the snow/ice interface temperature.
Sensitivity to changes in Emissivity In general, over an area of tens of kilometers, the ice cover is composed of a mixture of ice types with inhomogeneous surface characteristics. The integrated emissivity of this spatially inhomogeneous mixture itself varies under different environmental conditions. During winter, such emissivities are relatively stable at low frequencies but not at higher frequencies. Because the emissivity changes as the ice goes through different stages of development, the retrieved ice concentrations of both algorithms will be affected. • Reported sensitivity results: Under conditions of 100% ice cover and for a change in brightness temperature of ±1K, the Bootstrap algorithm shows sensitivity ranging from 1.7% to 2.2%, depending on hemisphere, whereas the Team algorithm shows 1.8% for both the hemispheres. For 50% ice cover, the Bootstrap algorithm yields a sensitivity ranging from 0.8% to 1.1% and the Team algorithm sensitivity is 1.2%. • Results: The results indicate some large differences in ice concentrations between the two algorithms, in the inner pack, in the coastal regions and in some marginal ice areas for Antarctica. For Arctic region, the differences in retrieval are smaller. The same is now tried with F13 SSM/I data for Jan 2002. The results are shown in the plots (attached along with this presentation).