Download
1 / 41
410 likes | 550 Views
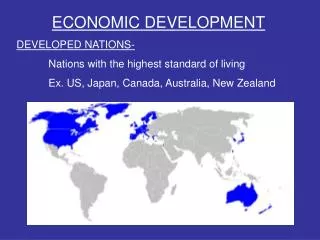
Materials and the Environmen t Part 3 – Global Consumption Patterns: Uneven but Changing (Most recent update April 1, 2013). The most economically developed nations are also the highest consuming nations.

E N D
Materials and the EnvironmentPart 3 – Global Consumption Patterns: Uneven but Changing(Most recent update April 1, 2013)
The most economically developed nations are also the highest consuming nations.
As a result, only a few nations consume by far the greatest share of the world’s raw materials.
Selected Raw Material Consumption in the United States and Western Europe Source: UNEP. 2004. Vital Waste Graphics. GRID Arendal (http://www.grida.no/publications/vg/waste/page/2857.aspx)
Consumption of Selected Raw Materials Compared to Global Population France, Germany, Japan, UK, & United States (5 countries) Rest of World (188 countries) Source: UNEP. 2004. Vital Waste Graphics. GRID Arendal (http://www.grida.no/publications/vg/waste/page/2857.aspx)
As shown in the next several graphics, developing nations are beginning to consume a greater share of the world’s resources as their economies expand.
Note that the developed countries, that in 2010 comprised 10.7% of world population, consumed a much greater percentage of critical resources.
Percent of Global Consumption of Selected Materials by Developed Nations* Percent of world population, 2010 (10.7%) Note that the portion of critical materials consumed by developed nations is decreasing as developing nations make economic gains. * Developed nations included in consumption statistics are the United States, Canada, EU-15 nations, Japan, Australia, New Zealand, and S. Korea.
Percent of Global Consumption of Selected Materials by the United States Percent of world population, 2010 (4.5%) 2010 consumption in the U.S. was very much affected by the great recession. Will rebound. Source: U.S. Geological Survey (2013); U.S. Dept. of Energy, EIA (2013).
The shift in global consumption patterns is led by China, but is by no means limited to developments in China alone.
China’s Gross Domestic Product(Expressed in Current $US) Billions of Current U.S. Dollars Source: World Bank, 2013.
China Consumption of Critical Materials 1990-2010 (percent of world consumption) Sources: USGS, IISI, OECD, USDOE-EIA (2013)
Raw material consumption patterns will continue to shift as nations now classified as developing become increasingly economically developed.
GDP* in the U.S. vs. Other Economies, 2005 Trillion US $ China India * GDP is the value of all goods and services produced within a nation’s borders. Values expressed in purchasing power parity. Source: International Monetary Fund (2006)
GDP in the U.S. vs. Other Economies, 2010 Trillion US $ Source: International Monetary Fund (2013)
Projected GDP in the U.S. vs. Other Economies, 2030 Trillion US $ Source: PWC Macroeconomics, UK (2011)
Projected GDP in the U.S. vs. Other Economies, 2050 Trillion US $ Source: PWC Macroeconomics, UK (2011)
This translates to increasing consumption of both goods and raw materials in countries that have long been characterized by low per-capita consumption and large populations. Fierce competition for the world’s raw materials is certain, and already gaining momentum.
So, in this environment, how is the U.S. positioned for the future?
The U.S. is a net importer of most categories of raw materials used to support our economy and lifestyle.
The U.S. is a net importer of most categories of raw materials used to support our economy and lifestyle. • Most metals • Portland and masonry cement • Petroleum (the basis for most plastics) • Wood and wood products
In the slides that follow, net import dependence is shown. Principal suppliers are also listed in order of importance, with the most important supplier listed first (to the left), the next most important to the right of that, and so on.
Net U.S. Imports of Selected Materials as a Percent of Apparent Consumption - 2011, and by Major Foreign Sources a/ b/ c/ d/ Material% ImportedPrincipal Foreign Sources (2007-10) Niobium 100 Brazil, Canada, Germany, Russia Manganese 100 S. Africa, Gabon, China, Australia Graphite 100 China, Mexico, Canada, Brazil Strontium 100 Mexico, Germany Bauxite/Alumina 100 Jamaica, Brazil, Guinea, Australia Fluorspar 100 Mexico, China, S. Africa, Mongolia Yttrium 100 China, Japan, France, UK Thallium 100 Russia, Germany, Kazakhstan Rubidium 100 Canada Asbestos 100 Canada, Zimbabwe Quartz (crystal) 100 China, Japan, Russia Thorium 100 France, India, Canada, UK Tantalum 100 China, Germany, Kazakhstan, Australia
Net U.S. Imports of Selected Materials as a Percent of Apparent Consumption - 2011, and by Major Foreign Sources a/ b/ c/ d/ Material% ImportedPrincipal Foreign Sources (2007-10) Arsenic (trioxide) 100 Morocco, China, Belgium Indium 100 China, Canada, Belgium, Japan Rare earth metals 100 China, France, Estonia, Japan Cesium 100 Canada Mica (natural) 100 China, Brazil, Belgium, India Iodine 99 Chile, Japan Gallium 99 Germany, Canada, UK, China Gemstones 98 Israel, India, Belgium, S. Africa Germanium 90 China, Belgium, Russia, Germany Bismuth 89 China, Belgium, UK Diamond (dust, grit) 89 China, Ireland, S. Korea, Russia Platinum Group 88 Germany, S. Africa, UK, Canada Antimony 87 China, Mexico, Belgium
Net U.S. Imports of Selected Materials as a Percent of Apparent Consumption - 2011, and by Major Foreign Sources a/ b/ c/ d/ Material% ImportedPrincipal Foreign Sources (2007-10) Rhenium 87 Chile, Netherlands, Germany Stone (dimension) 85 Brazil, China, Italy, Turkey Potash 83 Canada, Belarus, Russia Lithium 80+ Argentina, Chile, China Vanadium 80 S. Korea, Canada, Austria, Czech Rep. Barium (Barite) 78 China, India Silicon carbide 76 China, Brazil, Vietnam, Norway Tin 76 Peru, Bolivia, Indonesia, China Cobalt 75 China, Norway, Russia, Canada Silver 75 Mexico, Canada, Peru, Chile Zinc 73 Canada, Peru, Mexico, Ireland Titanium (sponge) 69 Kazakhstan, Japan, China, Russia Titanium concentrates 68 S. Africa, Australia, Canada, Mzambique
Net U.S. Imports of Selected Materials as a Percent of Apparent Consumption - 2011, and by Major Foreign Sources a/ b/ c/ d/ Material% ImportedPrincipal Foreign Sources (2007-10) Peat 63 Canada Chromium 60 S. Africa, Kazakhstan, Russia, China Palladium 56 Russia, S. Africa, UK, Norway Magnesium Cpds 53 China, Canada, Brazil, Austria Nickel 47 Canada, Russia, Australia, Norway Ferrosilicon 42 China, Russia, Venezuela, Canada Nitrogen (fixed) 41 Trinidad/Tobago, Russia, Canada, Ukraine Petroleum 40 Canada, Saudi Arabia, Venezuela, Russia, Iraq, Nigeria, Mexico Garnet (industrial) 39 India, Australia, China, Canada Gold 36 Mexico, Canada, Colombia, Peru Tungsten 36 China, Bolivia, Canada, Germany Magnesium Metal 35 Israel, China, Canada
Net U.S. Imports of Selected Materials as a Percent of Apparent Consumption - 2011, and by Major Foreign Sources a/ b/ c/ d/ Material% ImportedPrincipal Foreign Sources (2007-10) Copper 35 Chile, Canada, Peru, Mexico Perlite 27 Greece Lumber (softwood) 25 Canada, Chile, Sweden, Germany Sulfur 24 Canada, Mexico, Venezuela Salt 22 Canada, Chile, Mexico, The Bahamas Beryllium 21 Russia, Kazakhstan, Japan Mica (scrap/flake) 20 Canada, China, India Vermiculite 20 China, S. Africa, Australia, Brazil Gypsum 13 Canada, Mexico, Spain Phosphate rock 13 Morocco, Peru Aluminum 13 Canada, Russia, China, Mexico Iron and steel 9 Canada, EU, China, Mexico Cement (Portland/msry) 6 Canada, China, S. Korea, Mexico Pumice 5 Greece, Mexico, Iceland, Montserrat
Net U.S. Imports of Selected Materials as a Percent of Apparent Consumption - 2011, and by Major Foreign Sources a/ b/ c/ d/ Material% ImportedPrincipal Foreign Sources (2007-10) Diamond (industrial) 3 Botswana, S. Africa, Russia, Nambia Lime 1 Canada, Mexico Stone (crushed) 1 Canada, Mexico, The Bahamas a/ U.S. Geological Survey. 2013. Mineral Commodity Summaries - 2012. b/ Principal foreign sources arranged by most important supplier to the left, next most important to the right of that, and so on. c/ Petroleum data from U.S. Department of Energy, Energy Information Administration 2013 (February). d/ Data for construction lumber from RISI, Random Lengths, 2012, 2013.
The United States is also a net importer of durable and non-durable goods of all kinds.
The U.S. is a massive net importer partly because many economically accessible resources lie outside U.S. borders . . .
. . . but also because environmental regulations and policies have created barriers to domestic production and increased associated costs.
The net result is a shift of environmental impacts linked to our consumption to locations outside of the U.S.
While supplies of most raw materials are unlikely to physically run out, there are growing concerns about availability.
In a 2011 global survey of 69 leading companies, resource scarcity was identified as a major concern in all industries represented. Source: European Technology Platform on Sustainable Mineral Resources. 2012. (http://eurogeosurveys.org/assets/ETPSMR/SF2012/1.The%20contribution%20of%20ETP%20SMR%20-%20Henryk%20Karas.pdf)
The European Environment Agency described concerns this way: “The world's stocks of natural resources are already decreasing. A larger and richer global population with increasing consumption needs will make bigger demands for many things including food, water and energy. In the future, rising demand and falling supply could intensify global competition for resources . . .
The European Environment Agency described concerns this way: . . . Growing long-term scarcity of minerals and metals may induce us to turn to sources hitherto deemed uneconomic. Expanding mining has several environmental effects, including changing landscapes, polluting water and generating waste. Poorer quality mineral reserves may mean that exploiting such sources is less energy efficient.” Source: European Environment Agency. 2011. (http://www.eea.europa.eu/signals/signals-2011/earth-2050-global-megatrends/intensified-global-competition-for-decreasing)
Summary • Per capita consumption of raw materials is far higher in the most economically developed countries than in countries that are not as economically advanced. • The global economy is changing rapidly, with many traditionally low-income countries now experiencing rapid economic growth. • Economic expansion is affecting regions of the world characterized by very large populations. • Consumption of raw materials of all kinds is increasing very rapidly.
Summary • Several high consuming countries, including the United States, Japan, and European countries, are massive net importers of raw materials. • While the world is unlikely to literally run out of most raw materials, there are questions about future availability in a world of increasing competition for those resources. • As global competition for raw materials increases, countries may have to form new alliances and relationships.
Summary • Appropriate technology development relative to resource development, use, and recycling will be essential. • Reconsideration of domestic policies, to potentially allow greater access to domestic resources, will likely be needed. • Environmental and social concerns will increase as raw material consumption rises.