Download
1 / 10
100 likes | 247 Views
CNR - National Research Council of Italy Institute of Marine Sciences in Ancona. AcousMed. WP3 Acoustic data day-night comparison. I. Leonori , A. De Felice.

E N D
CNR - National ResearchCouncil of Italy Institute of Marine Sciencesin Ancona AcousMed WP3 Acoustic data day-night comparison I. Leonori, A. De Felice
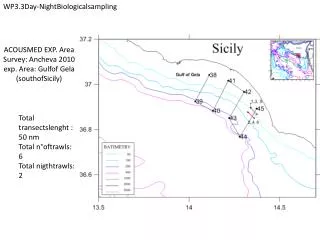
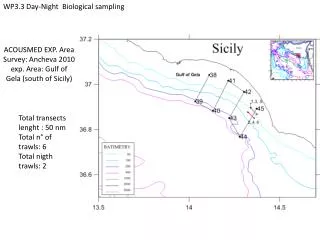
Four field experiments were carried out in the Adriatic Sea to compare day time and night time acoustic data, 3 surveys in 2009 and 1 survey in 2010. Each survey was held three times, twice during daytime and once during nighttime. 6 hauls were carried out during each survey: 2 hauls were done the first day, 2 hauls were repeated in the same positions the following night and other 2 hauls the day after. During 2009 ad hoc surveys were carried out in Manfredonia Gulf (South Adriatic Sea, 9-10 August 2009) and in two different locations in the Middle Adriatic Sea (near Vasto 11-12 August and near San Benedetto 30 September – 1 October). Each survey had a maximum length of about 50-60 nm and a maximum transect length of about 14 nm. Areas varied in term of bathymetry (22-35 m 1st survey, 43-56 m 2nd survey and 68-92 m 3rd survey) therefore hauls were carried out at different depths. The 2010 survey was carried out near Barletta, in the Southern Adriatic Sea, during 21 - 22 July 2010. This survey had a length of about 45 nm and a maximum transect length of about 9 nm. Bottom depth was 94 - 105 m.
2010 2009
Acoustic data collected during each survey were analyzed in order to identify any significant differences in terms of total NASC of the entire water column between the day time and the night time recordings. • The horizontal integration unit was fixed to 300 pings (150 m: about 0.34 nm) so mean area backscattering coefficients were estimated for each 300 ping unit. • According to the agreed protocol MyriaxEchoview software was used for the data analysis. Data were analyzed at two frequencies: 38 kHz and 120 kHz. • Sv threshold during daytime was set at -70 dB and -60 dB and during nighttime at -70 dB, -60 dB and -55dB. • Mean area backscattering coefficients and their confidence intervals were calculated (Jolly & Hampton formula of (1990)) for each survey held during the first day, the night after and the second day. • Transect parallel to the coast were excluded from the analysis. • mean NASC & variance estimates were obtained using the formula of Jolly & Hampton (1990) as described by Coombs and Cordue (1995).
& is the mean NASC for the i-th transect, ni is the EDSU numbers for the i-th transect, and N is the number of transects.
1° case study – Survey MANFREDONIA, Southern Adriatic Sea, 9 - 10 August 2009 38 kHz 120 kHz Results indicated small differences between NASC values estimates during daytime and nighttime. At 120 kHz, estimated confidence intervals during daytime were much higher compared to night-time sampling.
2° case study – survey VASTO, Middle Adriatic Sea, 11-12 August 2009 The Day1 and Day 2 NASC mean value were quite similar for the same threshold and lower compared to Night mean NASC value for each Sv threshold. Estimated confidence intervals were smaller for Day than Night sampling. 38 kHz The Day1 and Day 2 NASC mean value were quite similar for the same threshold and lower compared to Night mean NASC value for each Sv threshold. Estimated confidence intervals were smaller for Day than Night sampling. 120 kHz
3° case study – survey SAN BENEDETTO, Middle Adriatic Sea, 30 September - 01 October 2009 38 kHz 120 kHz The differences between daytime and night time are similar to the differences between day 1 and Day 2 estimated NASC values.
4° case study – survey BARLETTA, Middle Adriatic Sea, 21-22 July 2010 The Day1 and Day 2 NASC mean value were quite similar for the same threshold and lower compared to Night mean NASC value for each Sv threshold. Estimated confidence intervals were smaller for Day than Night sampling. 38 kHz The Day1 and Day 2 NASC mean value were quite similar for the same threshold and lower compared to Night mean NASC value for each Sv threshold. Estimated confidence intervals were very smaller for Day than Night sampling. 120 kHz
Some comments • Loss of fishduring the daybecausetoonear to the bottom in Vasto and Barletta areascouldexplainhigher NASC valuesduring the night? • In S. Benedetto, Vasto and Barletta minisurveys a plankton layerisvisiblebothduringday and night butduring the night fish and plankton tend to be atsimilardepths; anywayonly in Vasto and Barletta significantdifferenceswerefound • S. Benedetto and Barletta minisurveyswere made athigherdepthsbutonly in the second case thereweredifferences. Vasto minisurveywas made atshallowerdepths • Difficult to find out a reason to explainwhydifferences in 2 cases over 4