Download
1 / 21
210 likes | 237 Views
Explore the major inputs of nitrogen in the ocean, focusing on deep water, nitrate, and atmospheric deposition. Learn about the nitrogen cycle, isotopic values, and processes influencing nutrient profiles. Discover how nitrogen fixation, denitrification, and other factors impact marine plant ecosystems.

E N D
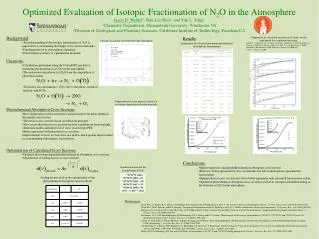
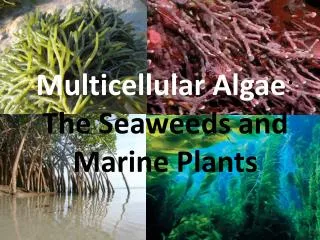
15N in marine plants Alison Collins
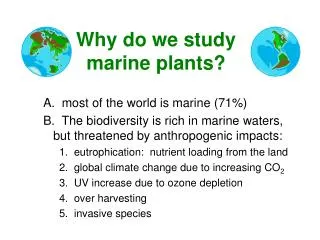
Major Inputs of Nitrogen in the Ocean • Deep Water • Nitrate • Atmospheric deposition • Largest in areas near continental land masses • Nearshore and continental shelf waters • Terrigenous runoff may be a large source
Outline • Broad processes • Seasonal processes
Nitrogen Cycle +5 NO3- ~35 0/00 nitrification NO2- denitrification N2O nitrate assimilation ~20 0/00 NO2- N2 0 nitrogen fixation phytoplankton 0 0/00 nitrification ammonification ammonia assimilation ~15 0/00 NH4+ -3
Deep Water Circulation global 15N values of deep water Global Average d15N ~4‰ - 5‰
Sources • N2 fixation: δ15N ~0‰ for phytoplankton - BUT…low value could also be an indication of recycled NH4+ being used in oligotrophic waters • NO3: available through upwelling and convection - δ15N depends on regional processes - δ15N >0 • NH4+ : available from urea - typically lighter than the global ocean average - δ15N is low
Differential 15NO3- in Surface Waters Nitrogen fixation – waters ~0 ‰ Denitrification – waters isotopically heavy Riverine input – depends on inputs in watershed; heavy if fecal material, light if agricultural input, soil signature if relatively pristine Atmospheric deposition - waters ~0 ‰
Atmosphere Reassimilation regenerated production new production nitrogen fixation vertical mixing (Upwelling) export production ** 15N value of phytoplankton will be very close to the average of the 15N of the new nitrogen as long as all the nitrogen is utilized by phytoplankton
Nutrient Profiles – Monterey Bay • Inverse relationship between [NO3-] and d15NO3- • d15NO3- decreases with depth due to remineralization of sinking particles • d15NO3- higher than oceanic values (4‰ - 5‰) – probably due to infusion of California undercurrent waters
Nutrient Profiles – Gulf of California • Surface waters are enriched compared to Monterey profile • Increase in d15N at the surface is most likely due to uptake by phytoplankton • Nitrate drawdown (by denitrifying bacteria) within OMZ corresponds with increase in d15N
Outline • Broad processes • Seasonal processes
i Upwelling equatorward winds surface waters nutrient rich water from depth
Variation in d15N during upwelling • d15N at minima shortly after upwelled waters come to surface then increase until all nitrate is taken up d15NO3 [NO3] d15NO3 [NO3] upwelling begins time
Nitrogen Fixation • Lower than average d15N values • d15N of sediment increases with depth • Isotopically light sinking organic matter lowers the d15N of the subsurface pool below the global deep water average • Subsurface pool d15N is a mix between particle flux from the surface and vertical mixing of deep water
Trichodesmium abundance and d15N of zooplankton • d15N values lowest with highest abundance of Trichodesmium • d15N values highest in areas with low abundance of Trichodesmium
Shows that d15N is inversely related to N utilization, with lower values where waters still have [NO3] available
Available nitrate similar to leakiness in land plants Plant 13 δ C (if atm = - 8 ‰ ) δ i ε f ε ε = = +4.4 ‰ δ - 12.4 ‰ p t 1 δ f - 27 ‰ ε ε = = +27 ‰ - 35 ‰ p f 0 0.5 1.0 Fraction C leaked ( φ / φ ? C /C ) 3 1 i a available nitrate φ , δ , ε 3 3 t φ , δ , ε C , δ 1 1 t a a C , δ C , δ i i a a Inside leaf C , δ f f φ , δ , ε 2 2 f
Bottom Line… • d15N of phytoplankton depends on: • denitrification • nitrogen fixation • upwelling and currents