Download
1 / 18
0 likes | 19 Views
The purpose of this study was to develop snacks based on electrical cabinet and tunnel solar dried mango (Mangifera indica cv. Dodo), pineapple (Ananas comonsuss cv. Smooth cayenne) and bananas (Musa acuminate cv. Kisukari). The developed snacks include; dried fruits and fruit leather. The products were assessed for their safety, nutritional and shelf-life stability, whereby a factorial design was used to determine their effects on proximate, vitamin A and C, water activity and microbial load. The results showed significant differences (p<0.05) in proximate composition, vitamins (A and C),

E N D
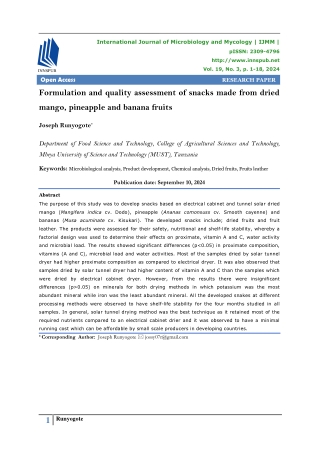
International Journal of Microbiology and Mycology | IJMM | pISSN: 2309-4796 http://www.innspub.net Vol. 19, No. 3, p. 1-18, 2024 Open Access RESEARCH PAPER Formulation and quality assessment of snacks made from dried mango, pineapple and banana fruits Joseph Runyogote* Department of Food Science and Technology, College of Agricultural Sciences and Technology, Mbeya University of Science and Technology (MUST), Tanzania Keywords: Microbiological analysis, Product development, Chemical analysis, Dried fruits, Fruits leather Publication date: September 10, 2024 Abstract The purpose of this study was to develop snacks based on electrical cabinet and tunnel solar dried mango (Mangifera indica cv. Dodo), pineapple (Ananas comonsuss cv. Smooth cayenne) and bananas (Musa acuminate cv. Kisukari). The developed snacks include; dried fruits and fruit leather. The products were assessed for their safety, nutritional and shelf-life stability, whereby a factorial design was used to determine their effects on proximate, vitamin A and C, water activity and microbial load. The results showed significant differences (p<0.05) in proximate composition, vitamins (A and C), microbial load and water activities. Most of the samples dried by solar tunnel dryer had higher proximate composition as compared to electrical dryer. It was also observed that samples dried by solar tunnel dryer had higher content of vitamin A and C than the samples which were dried by electrical cabinet dryer. However, from the results there were insignificant differences (p>0.05) on minerals for both drying methods in which potassium was the most abundant mineral while iron was the least abundant mineral. All the developed snakes at different processing methods were observed to have shelf-life stability for the four months studied in all samples. In general, solar tunnel drying method was the best technique as it retained most of the required nutrients compared to an electrical cabinet drier and it was observed to have a minimal running cost which can be affordable by small scale producers in developing countries. * Corresponding Author: Joseph Runyogote jossy07r@gmail.com 1 Runyogote
Introduction best alternative as it produces product quickly Fruits play an important role in human nutrition and in hygienic manner with substantial retention and health, particularly as sources of vitamin C, of valuable nutrients (Mongi, 2013). Furthermore, thiamine, niacin, pyridoxine, folic acid, minerals, solar drying is seen as a means of providing phytochemicals and dietary fiber (Wargovich, opportunities for value addition and income 2000). Other vital nutrients supplied by fruits and generation from marketing produce in local, include; riboflavin, zinc, calcium, potassium and regional and inter-national markets. Therefore, phosphorus. The health benefit of fruits is the study was carried out to formulate snacks associated with the presence of these valuable based on solar and electrical dried banana, nutrients. The distribution of antioxidant capacity pineapple and mango fruits in Tanzania. in fruits varies greatly depending on the type of fruit and location of the fruit itself (Runyogote et Material and methods al.,2021). With this variation of some nutritional Research areas contents in fruits it is better to consume a variety The study was conducted in Morogoro Municipal of them rather than limiting consumption to a few Council. All drying activities were done at Danida with the highest antioxidant capacity (Kalt, project premises, Sokoine University of 2002). However, despite these merits, fruits are Agriculture (SUA) while laboratory analysis was seasonal and highly perishable leading to done at the Department of Food Science and enormous post-harvest losses. Lack of handling Technology laboratory. and processing knowledge and facilities are among many factors for their greater losses. Only Materials less than 10% of the produced fruits are being Mango (Mangifera indica), banana (Musa sp.) and processed in the country leading to both nutrition pineapples (Ananas comosuss) were purchased and economic losses (MACF, 2009). from Morogoro Municipal Market. Analytical grade reagents, chemicals and equipment for chemical The market for dehydrated fruits is important for and microbiology analysis were purchased from most countries worldwide (Funebo and Ohlsson, Py-rex East Africa suppliers and some obtained 1998). Dehydration is one of the techniques that from Food science and Horticulture laboratories at offers a means of preserving foods in a stable SUA. and safe condition as it reduces water activity and extends shelf-life much longer than that of Research design fresh fruits. Different foods such as cereals, fruits A purposive sampling procedure was used to and vegetables, may be dried using different collect a variety of each fruit (Mango cv. Dodo, methods depending on the purpose of drying and banana cv. Kisukari and pineapple cv. Smooth the availability of technology. The drying methods cayenne) from Morogoro Municipal market in available range from those harnessing solar order to obtain fruits with better characteristics. energy as a source of energy to modern A total of 360 samples were collected (i.e.120 mechanical and electrical methods using fuel and Mangoes, 60 pineapples and 180 bananas) and electricity as sources (Makanjuola et al., 2013). subjected to two drying methods (solar tunnel Open sun drying is the oldest and most common and electrical cabinet dryers) and dried products method that has been used in preservation of were used to develop different snacks agricultural produces in developing countries. formulation. Factorial designs were used in the However, the methods have been associated with study and the principal factors were snack type in-built quality problem due to environmental and and dryer type (solar tunnel and electrical cabinet biological effect. Solar drying seems to be the dryers). For dried fruit products 7 x 2 factorial 2 Runyogote
design was used while for fruit leather products 5 texture, aroma, taste and general acceptability x 2 factorial design was applied. The effect of using a consumer panel of 20. The most liked these factors on proximate, vitamin A and C, ratio was 1:1 and hence opting for this ratio for water activity and microbial load were further investigation as indicated in Table 1. The determined. developed snacks were packed into plastic bags and stored at room temperature prior to Drying procedures analyses. Fresh mature ripe fruits samples were washed, peeled and sliced to 6 mm thick for pineapple and Table 1. Different formulation of mixed dried 9 mm thick for banana and mango, each sample fruits was divided into 3 portions that were subjected in equal loading density of 3 kg/m3 to either solar Fruit blends Fruit ratios BananaPineappleMango 1 0 0 1 0 0 0 1 1 0 1 1 1 1 Banana Pineapple Mango Mango: Pineapple Mango: Banana Banana: Pineapple Mango: Banana: Pineapple 0 0 1 1 1 0 1 drying tunnel with temperature ranging from 60- 800C for about 2 days or cabinet electrical dryer with constant drying temperature of 60 -70°C for 10 hours as indicated in Fig. 1. The solar tunnel dryer temperatures were determined during drying process but observed during drying period. Fruit leather Samples were offloaded from dryers after Fresh mature ripe fruits were washed, peeled, cut predetermined moisture levels which ranged from into small pieces and blended (Table 2) to obtain 13-17%. The dried pieces of fruits were packed in the fruit puree. The obtained fruit puree was polyethylene bags and stored at 4°C waiting for dried by tunnel and cabinet dryers to obtain the analysis (Mongi, 2013). fruit leather. The developed snacks were packed into plastic bags and stored at room temperature prior to analyses. Table 2. Different formulation and rations of fruits leather developed Fruit blends Fruit ratios Banana Pineapple Mango 0 0 1 0 3 0 1 1 3 7 Mango Mango: Banana Mango: Banana Mango: Pineapple Mango: Pineapple 1 1 7 0 0 Proximate analysis Determination of moisture content Fig. 1. General flow diagram for fruit drying The moisture content was determined (Modified from King’ori et al., 1999) according to standard oven drying method Product formulation explained by AOAC (1995). The sample was first weighed (W1) transferred into a pre- Mixed dried fruits weighed crucibles (W2) and oven dried at 1100C Several formulations were developed with for overnight. After this the crucibles with different ratios of mixed dried fruits and pre- contents were cooled in a desiccator and re- tested for sensory parameters including color, 3 Runyogote
weighed (W3). The amount of moisture in The thimble support holder was used to insert the thimbles into the extraction unit, then the cup percentage was calculated as follows: holder was used to insert the extraction cup containing 70 ml of solvent (40- 60°C petroleum % Moisture content =W1 − (W3 − W2) × 100 W1 ether) and extraction proceeded for about 2 Determination of protein content hours. The extraction process involved three Kjeldahl procedure was used for the stages boiling (15 minutes), rinsing (45 minutes) determination of protein (AOAC, 1995)using and recovery (10 minutes). The cup containing extracted fat was dried in an oven at 1050C for block digestion and steam distillation (Kjeltec TM 8200 Auto distillation unit 2012). About 0.25g of 30min, cooled in desiccator and weighed. The dried fruit sample was weighed and transferred percentage fat was calculated as follows: Weight of lipid (g) Weight of sample (g)× 100 into a digestion flask in which approximately 2g % Fat = of catalyst mixture (CuSO4, K2SO4) were added Determination of ash followed by approximately 6 ml of concentrated sulphuric acid. The contents of the flask were The ash content was determined by heating a digested by heating in a fume chamber for about sample in a muffle furnace as described in 1hour to allow the nitrogen held in the standard method (AOAC, 1995). About 5 g of heterocyclic ring to be released. The content was sample was weighed in a pre- weighed crucible and transferred to a furnace at 5500C and left connected to the nitrogen distillation unit containing 80 ml distilled water and 50 ml of 40% v/w NaOH, which convert ammonium (NH4+) into overnight. The crucible was then cooled in a desiccator. The ash was weighed and expressed ammonia (NH3) thereafter steam distilled into a as percentage of the original sample weight on flask containing 30 ml boric acid solution with dry weight basis. The percentage ash was mixed indicators (bromocresol green and methyl calculated as follows: red). Distillation was allowed to proceed until ????? ?? ??? ?????? ?? ??????× 100 % Ash = 100-150 mls were collected. The distillate was titrated with 0.1N HCl until color change from Determination of crude fiber blue to dirty green or orange endpoint was Crude fiber was determined using dilute acid and observed, the volume of acid used for alkali hydrolysis as described by AOAC (1995) neutralization was noted. The percentage of using Fibertec 2010. The Weende method was crude protein was calculated as follows: used whereby about 1g of the sample was % Nitrogen= {(1.401× (titre-blank)mls × accurately weighed into glass crucible and about Concentration of acids in molarity)/(sample 200 ml of boiled 1.25% H2SO4 was poured into weight (g)} the flask and then the mixture was boiled for % crude protein=% N×conversion factor exactly 30 minutes under reflux condenser. The A conversion factor of 6.25 was used to convert insoluble matter was washed with boiling water nitrogen into protein 3-4 times until the residue was free from acid. About 200 ml of 1.25% boiling potassium Determination of fat/ lipid hydroxide solution was added into the residue The fat content was determined by solvent and then heated for 30 minutes under reflux extraction method as described in standard method (AOAC, 1995) using SoxtecTM 2055 condenser. The residue was filtered, washed with boiling water and then crucible was transferred to (manufacturer). About 3 g of dried fruit sample the cold extraction unit and washed with acetone. After digestion, the residues were dried at 105°C was weighed and then transferred into extraction thimble and covered with defatted cotton wool. 4 Runyogote
422.7nm, sodium 587.0nm and phosphorus for 5 hours in an air convection oven, cooled in a desiccator to a constant weight and weighed. The 840.0nm. residue was incinerated in an electric furnace at 525°C for about 3 hours until all the The Standard curve plot (Appendix 6-10) of carbonaceous matter was burnt. The crucible was left to cool down to below 250°C then removed absorbance against the known concentration of standard solutions (0.5, 1, 1.5, 2. 0, 2 .5 and 3.0 from the furnace and transferred to the ppm) was used to determine the concentration of desiccator, cooled to room temperature and minerals in samples and expressed as in the weighed. Percentage crude fiber was calculated following formula. as follows: %Crude fibre content =(B − C) Mineral content (mg/100g)=(Reading value in ppm ×dilution factor×100)/(Sample weight (g)) × 10 A Where; A is the weight of sample (g), B is the Vitamin A and C determination weight of crucible with dried residue after Beta carotene determination (Precursor of digestion (g) and C is the weight of crucible with vitamin A) ash (g) Beta carotene determination was done according to Delia and Mieko (2004), about 1g of fruit Determination of carbohydrate sample was weighed, transferred into a motor The carbohydrate content was determined by a and pestle, ground to facilitate the extraction difference method as follows: procedure and about 1.5g of celite was added to % Cabohydra=100-(% Moisture content +% aid in grinding process. The mixture was ground with 50 ml of acetone (acetone refrigerated at 40 Crude fibre+ % ash content+% lipid+% protein) C for 2 hours prior to use). The extraction was Mineral analysis repeated until the sample from the mortar was The ash content was used for analysis of devoid of color (clear). About 50 ml of petroleum minerals according to the AOAC (1995) ether was put in a separating funnel (250 – 500 procedures. The mineral content was ml capacity) and the acetone was added. Distilled determined by the use of Unicam 919 Atomic water was added slowly along the neck without Absorption Spectrophotometer (AAS UNICAM shaking to avoid emulsion formation (water 919). Test portions were dried and then ashed stones) in the carotenoid extracts. The two at 450°C under a gradual increase (about 500C/hr) in temperature. phases were then left to separate for 30 minutes and the lower aqueous layer was discarded, the sample was washed 3-4 times with distilled water The residue was dissolved in 0.1 N HNO3 left to (approximately 200 ml was used) each time to dissolve then filtered using a whatman filter remove residual acetone that was used in the paper No.1. The analytes were analysed by extraction process, the last phase washing was flame procedures. The set instrument was as done to ensure that no any amount of the upper per the previously established optimum phase was discarded. The washed samples were condition / as per the guidelines given in the then passed through anhydrous sodium sulphate instruction manual. The absorbance of sample to make it free from any trace of water. The dried and standard solutions was determined. The carotene extracts was then collected into a clean standard conditions for Atomic Absorption and dry volumetric flask. The extract was then Spectrophotometer (Element wavelength read under UV-Visible Spectrophotometer flame-gases) were: zinc 319.9nm, iron (Wagtech, CECIL 2021) at a wavelength of 248.8nm, potassium 766.5nm, calcium 450nm to obtain its absorbance. After obtaining 5 Runyogote
results were read when the stable value was the absorbance beta carotene concentration was displayed. calculated using the equation of the standard. Determination of ascorbic acid (Vitamin C) Determination of shelf life Vitamin C (Ascorbic acid) was determined based on Shelf life was determination by assessment of the oxidation reduction reaction principle through microbial loads (in the 2nd and 4th months) of the following procedures. 5g of the homogenized dried fruit samples from two drying methods fruit sample was weighed. Using a motor and pestle (solar tunnel and electrical cabinet electrical fruit juice was extracted using 10 mls portions of dryers) packed in polythene bags and stored at 10% TCA and the extract was collected into a room temperature for four months. The effect volumetric flask. The diluted sample extract was of these factors on microbial load was assessed then filtered using Whatman filter paper No.1. and compared. Samples were taken for 10mls of a clear filtrate was pipetted into 250ml evaluation in an interval of two months. Erlenmeyer flask and then a blank solution was prepared by taking 10mls of 10% TCA solution into Microbiological analysis (Total count, fungi and 250ml Erlenmeyer flask. Then the burette was filled coliform) with standard Indophenols solution adjusted to zero Total bacterial count meniscus. Slowly the content was titrated with Total number of microorganisms were analyzed standard solution of indophenol until faint pink color according to the ISO 4833 (2003) procedures. was obtained which persisted for 10 seconds About 12 ml to 15 ml of the plate count agar (Tomohiro, 1990). The volume of Indophenol (PCA) at 44 °C to 47 °C was poured into each solution used to oxidize the ascorbic acid present in Petri dish and carefully the inoculum was mixed the sample extract and in the blank solution was with the medium by rotating the Petri dishes recorded. Then the vitamin C content in the fruit and the mixture was allowed to solidify by sample extract was calculated using the formula leaving the Petri dishes standing on a cool indicated below. horizontal surface. After complete solidification Vitamin C content in mg/100g of the sample prepared dishes were inverted and placed in (???)∗?∗?∗??? ?∗? Whereby; A is the volume in ml of the = the incubator at 30 °C ± 1 °C for 72 h. After the specified incubation period the colonies Indophenol solution used for sample, B is the were counted. The counted number of colonies volume in ml of the Indophenol solution used forming units (CFU) per gram were calculated for blank, C is the mass in mg of ascorbic acid using the following formula; equivalent to 1.0ml indophenols solution, S is ∑C (n1 + n2)d ???/? = the mass of sample in (g) taken for analysis, V is the total volume of extract in milliliters and Where; ∑C is the sum of colonies counted on D is the volume of sample filtrate in milliliters the dishes retained, n1 is the number of dishes taken for analysis retained in the first dilution, n2 is the number Water activity determination of dishes retained in the second dilution, d is the dilution factor corresponding of the first Water activity was determined by the Labswift- dilution. water activity analyzer as described by Novasina (2010). The chopped samples were filled into the Coliform sample dish (three quarters of its volume) then Coliform was determined according to the ISO put into the measurement chamber and closed. 7251 (2005) procedures. This method is based The analyzer button was pressed there after the 6 Runyogote
on MPN procedures using the lauryl sulphate forming units (CFU) per gram were calculated using the following formula; ∑C ?n1 ? n2?d tryptose Brilliant-Green lactose bile broth each being incubated at 37oC for 24-48 hours. Fecal ???/? ? coliform (E. coli) EC broth was used, incubated Where; ∑C is the sum of colonies counted on the at 44oC for 48 hours. On confirmation for the dishes retained, n1 is the number of dishes presence of E. Coli KOVACS reagent was used. retained in the first dilution, n2 is the number of dishes retained in the second dilution, d is the Fungi (yeast and molds) dilution factor corresponding of the first dilution. Yeast and moulds were determined according to Statistical data analysis ISO 6611 (2004) procedures. About 15 ml of the medium containing chloramphenicol previously The data were analysed by using R statistical melted and maintained at 45°C in the water bath package (R Development Core Team, Version into each petri dish was carefully mixed with the 3.0.0, Vienna, Austria) for Analysis of Variance to inoculum. The Petri dishes were rotated and determine the significant (p<0.05) variations allowed the mixture to solidify by leaving the between the main factors. Mean was separated Petri dishes to stand on a cool horizontal surface. by Turkey’s Honest Significant difference The prepared dishes were inverted and placed (p<0.05). Results were expressed as mean ± SD them (while keeping in an upright position) in the and presented in tabular and graphical forms. incubator set at 25°C for 5 days. The colonies were counted on each dish distinguishing Results and discussion between colonies of yeasts and colonies of The developed products are dried fruits and fruit moulds on the basis of their morphological leather which are shown in Fig. 2 and Fig. 3 characteristics. The counted number of colonies respectively. Fig. 2. Dried fruits (mango, banana and pineapples) Fig. 3. Fruit leather (made from mango, banana and pineapples) 7 Runyogote
Table 3. The effect of drying methods on proximate composition (g/100g) of each dried product Products BP BT MB MD MP PS MBP Data presented as arithmetic means ± SD (n = 2). Means in each column for each product with different Dryer Electrical Tunnel Electrical Tunnel Electrical Tunnel Electrical Tunnel Electrical Tunnel Electrical Tunnel Electrical Tunnel Moisture 12.9±0.2b 14.8±0.3a 13.2±0.3b 14.1±0.2a 13.3±0.1b 15.2±0.6a 13.6±0.0b 14.1±0.2a 13.0±0.2b 14.1±0.2a 12.8±0.3b 13.3±0.1a 14.1±0.4b 16.1±0.2a Ash Protein 2.0±0.2b 2.9±0.3a 2.3±0.0a 2.2±0.3b 4.0±0.3a 2.0±0.3b 3.8±0.0a 3.4±0.2b 3.3±0.4b 3.8±0.2a 2.0±0.0a 2.0±0.0a 3.4±0.1a 3.1±0.5b Fat Fiber 4.3±0.2a 3.9±0.4b 3.1±0.1b 4.3±0.3a 5.2±0.3a 4.6±0.6b 4.1±0.3a 2.2±0.2b 2.0±0.2b 2.4±0.1a 3.9±0.2a 3.7±0.1b 2.7±0.1b 4.1±0.3a Carbohydrate 74.1±0.4a 72.7±0.8b 77.4±0.0a 75.7±0.2b 70.5±0.5a 71.9±1.2b 72.3±0.5b 73.9±0.8ab 75.1±0.6a 72.9±0.1b 78.5±0.1b 78.9±0.1a 72.8±0.1a 69.9±0.8b 6.7±0.2a 5.4±0.3b 4.0±0.5a 3.7±0.2b 6.4±0.2a 6.1±0.1b 6.1±0.1ba 6.4±0.2a 6.3±0.4b 6.4±0.2a 2.8±0.2a 2.0±0.1b 6.8±0.2a 6.5±0.3b 0.0±0.0b 0.3±0.2a 0.1±0.0a 0.0±0.0b 0.6±0.2a 0.2±0.1b 0.0±0.0a 0.0±0.0a 0.3±0.1b 0.4±0.0a 0.1±0.0b 0.2±0.0a 0.2±0.0b 0.3±0.1a superscript letters are significantly different at p<0.05. Key ; BP is mixed banana and pineapple, MB is mixed mango and banana, BT is dried banana, MD is dried mango, MP is mixed mango and pineapple, PS is dried pineapple and MBP is mixed mango, banana and pineapple. Proximate composition MBP formulations had the same contents of The effect of products on proximate composition protein and fat in each drying methods while PS in different formulations within the drying had the highest value of carbohydrate with methods is shown in Table 3. The results showed respect to other products (Table 3). Moreover, that among the formulations MBP had highest the results show significant (p<0.05) variations in moisture content in both electrical cabinet and the moisture content in each drying methods with solar tunnel dryers compared to other products. the solar tunnel dryer having the highest value of MD had no fat content in each dryer type. PS and moisture content in all formulations. Table 4. The effect of drying methods on proximate composition (g/100g) of each fruit leather Products BMS MBL ML MPL PMD Data presented as arithmetic means ± SD (n = 2). Means in each column for each product with different Dryer type Electrical Tunnel Electrical Tunnel Electrical Tunnel Electrical Tunnel Electrical Tunnel MC Ash Protein 2.7±0.1b 3.2±0.1a 2.4±0.4a 3.4±0.2a 3.1±0.0a 3.5±0.0b 2.4±0.0a 2.5±0.4b 2.4±0.2b 3.9±0.1a Fat Fiber 4.9±0.2a 4.8±0.1b 3.6±0.0a 2.7±0.2b 3.2±0.5a 2.5±0.1b 1.8±0.0b 3.0±0.3a 3.5±0.4b 5.4±0.3a Carbohydrate 73.8±0.0b 74.9±0.0a 75.6±0.0b 75.7±0.6a 75.8±0.4a 73.3±0.3b 79.8±0.1a 77.8±0.3b 74.8±0.3a 70.8±0.2b 13.9±0.1b 15.4±0.1a 14.5±0.4b 15.0±0.2a 15.1±0.3b 17.3±0.1a 13.8±0.1a 14.7±0.4b 16.6±0.0b 16.9±0.3a 3.2±0.1a 3.1±0.1b 3.8±0.1a 3.2±0.5b 2.7±0.2b 3.4±0.1a 2.1±0.2a 2.1±0.1a 2.7±0.2b 2.9±0.5a 0.0±0.0a 0.1±0.0a 0.1±0.0b 0.2±0.0a 0.0±0.0a 0.0±0.0a 0.0±0.0b 0.3±0.1a 0.0±0.0a 0.0±0.0a superscript letters are significantly different at p<0.05. Key: Mixture of banana and mango leather (BMS), mixture of mango and banana leather (MBL), mango leather (ML), mixture of pineapple and mango leather (MPL) and mixture of mango and pineapple leather (PMD). The effect of drying methods on proximate content was found in product ML for electrical composition (g/100g) of each fruit leather is dryer while sample MPL had the lowest moisture shown in Table 4. The results showed a content with the electrical dryer. Product PMD significant difference (p<0.05) in proximate and ML were observed not to contain fat content composition among the fruit leather products in all drying methods and on the other hand, analyzed. The significantly highest moisture sample MPL had the highest content of 8 Runyogote
carbohydrate while sample BMS had the highest fatty acids, producing hydro-peroxides, ketones content of fiber (Table 4). The effect of drying and acids, which may cause rancid and method on proximate composition was significant objectionable odors (Perera, 2005). (p<0.05). All products dried by solar tunnel dryer had the highest moisture content compared to Furthermore, the results show that, solar drying those dried by the electrical cabinet dryer. has no effects on crude fiber content of dried fruits and vegetables. This might be due to the Data presented as arithmetic means ± SD (n = fact that fiber is relatively insensitive to thermal 2). Means in each column for each product with processing, so its content is very similar in fresh different superscript letters are significantly and dried fruits and vegetables (Barret, 2007). different at p<0.05. Key: Mixture of banana and The results also suggest that, the methods mango leather (BMS), mixture of mango and applied and varieties have varied effects on banana leather (MBL), mango leather (ML), retention of some proximate composition values mixture of pineapple and mango leather (MPL) during drying due to different drying conditions and mixture of mango and pineapple leather and modes of operations such as drying air (PMD). temperature, air flow rate and drying rates that could be associated with these differences The results indicate the significant variations in (Mongi, 2013). proximate composition among the formulated products by different dryers. The variations Vitamin, minerals and water activity might have been caused by different reactions Table 5 shows the effect of drying methods on and behavior during drying which resulted into beta carotene concentration (µg/100g), Vitamin C different values between the varieties within (mg/100g) and water activity of each dried the fruit (Perera, 2005). The moisture content product. The results showed significant values observed in this study are in line with differences (p<0.05) in all dried products. that reported by Ajay et al. (2009) that, Sample MD had the highest concentration of beta depending on the agricultural product, water carotene in both the two drying methods content of properly dried food product vary (electrical cabinet and solar tunnel dryers) from 5-25% with successful drying. The compared to all other products whereas pineapple decrease in protein content was caused by dried by solar tunnel was observed to contain the degree of heat applied. This means that, as the least concentration of beta carotene among other temperature increases protein undergoes dried products (Table 5). Dried pineapple had the denaturation and interacts with other food highest content of vitamin C for both drying components, which may cause changes in methods (Solar tunnel and electrical cabinet solubility, texture and nutritive values dryers) followed by mango mixed with banana, (Damodaran, 2008). These findings agree with while dried banana had the lowest content of the reports of Morris et al. (2004); Eze and vitamin C (Table 5). Agbo (2011) that, nutritional losses during drying occur to great extent due to application The higher water activity was observed in the of heat, thereby decreasing the concentration samples dried by the solar tunnel dryer than of some nutrients especially protein. Although those samples dried by electrical cabinet dryer most of fruits and vegetables contain only (Table 5) this was due to the efficiency and the small quantities of lipids, may undergo constant set of temperature range of the enzymatic hydrolysis in the initial phase of electrical cabinet dryer throughout the drying drying and autoxidation reaction of unsaturated period. 9 Runyogote
Table 5. The effect of drying methods on beta carotene concentration (µg/100g), vitamin C (mg/100g) and Water activity on each dried product Products BP BT MB MD MP PS MBP Data presented as arithmetic means ± SD (n = 2). Means in each column for each product with different Dryer type Electrical Tunnel Electrical Tunnel Electrical Tunnel Electrical Tunnel Electrical Tunnel Electrical Tunnel Electrical Tunnel Beta carotene 2.2±0.0b 2.3±0.0a 0.7±0.2b 1.8±0.1a 17.0±3.4b 18.1±1.8a 37.7±5.0b 55.2±6.1a 14.6±2.1b 18.1±3.5a 0.4±0.0b 0.6±0.0a 7.4±4.3b 10.1±3.0a Vitamin C 29.3±2.7b 31.4±1.3a 24.3±1.4b 25.6±1.3a 29.6±1.3b 31.7±1.3a 27.0±0.0b 28.2±1.4a 28.2±1.3b 29.3±2.7a 30.6±1.4b 32.2±1.4a 27.9±0.0b 30.5±1.4b Water activity 0.40±0.0b 0.42±0.0a 0.40±0.0b 0.46±0.0a 0.40±0.0b 0.45±0.0a 0.40±0.0b 0.54±0.0a 0.41±0.0b 0.44±0.0a 0.42±0.0b 0.43±0.0a 0.42±0.0b 0.46±0.0a superscript letters are significantly different at p<0.05. Key ; BP is mixed banana and pineapple, MB is mixed mango and banana, BT is dried banana, MD is dried mango, MP is mixed mango and pineapple, PS is dried pineapple and MBP is mixed mango, banana and pineapple. Table 6. The effect of drying methods on beta carotene concentration (µg/100g), vitamin C (mg/100g) and water activity on each fruit leather product Products BMS MBL ML MPL PMD Data presented as arithmetic means ± SD (n = 2). Means in each column for each product with different Dryer type Electrical Tunnel Electrical Tunnel Electrical Tunnel Electrical Tunnel Electrical Tunnel Beta carotene 6.4±0.0a 7.1±0.0a 9.3±0.0b 9.5±0.0a 37.6±0.2b 37.8±0.1a 13.3±0.0b 18.1±0.0a 15.0±0.0b 15.1±0.0a Vitamin C 28.2±1.3b 31.4±0.4a 20.4±1.3b 30.2±1.3a 18.1±0.0b 20.1±1.3a 32.1±2.7a 27.1±1.3b 30.2±1.3b 31.6±2.7a Water activity 0.47±0.0a 0.46±0.0b 0.43±0.0a 0.42±0.0b 0.51±0.0b 0.52±0.0a 0.41±0.0b 0.44±0.0a 0.58±0.0a 0.53±0.0 b superscript letters are significantly different at p<0.05. Key: Mixture of banana and mango leather (BMS), mixture of mango and banana leather (MBL), mango leather (ML), mixture of pineapple and mango leather (MPL) and mixture of mango and pineapple leather (PMD). The effect of drying methods on beta carotene carotene than the electrical cabinet dryer in all concentration (µg/100g), vitamin C content products. (mg/100g), and water activity of each fruit leather product is shown in Table 6. The results This was due to the amount of heat being higher indicated significant differences (p<0.05) in all in electrical cabinet dryer than that of the solar products. Mango leather had the highest content tunnel dryer. Sample PMD had the highest of beta carotene concentration in all two drying content of vitamin C in both drying methods methods (Solar tunnel electrical cabinet dryers) (Solar tunnel and electrical cabinet dryers) to all while banana mango leather was observed to other products while sample ML had the lowest contain the least concentration of beta carotene content of vitamin C (Table 6). The effect of among other fruit leather products (Table 6). drying methods on vitamin C was also significant Fruit leather products dried by the solar tunnel (p<0.05) in which fruit leather products dried by dryer had the higher concentration of beta the tunnel dryer had the higher contents of 10 Runyogote
vitamin C in all samples except sample MPL in-activation the shorter drying time in the tunnel Which was observed to have higher content of dryer than the cabinet dryer reduced the vitamin C in the electrical dryer. Sample PMD had exposure time to oxidizing agents that resulted the highest water activity in both drying methods into relatively lower vitamin C degradation in its among all samples. The tunnel dryer had higher samples. This is in agreement with Santos and water activity in most of the sample with the Silva (2008) who reported that, the longer the exceptional of sample PMD (Table 6). drying period (low temperature, high relative humidity, thick product), the lower the retention The significant difference of beta carotene of ascorbic acid. This was further supported by concentration observed in different product is Methakhup (2003) who found the rate of ascorbic caused by the oxidative degradation of β- acid oxidation was pH dependent, showing a carotene as a result of thermal treatment at maximum at pH 5.0 and minimum at pH range of different temperatures. Borsarelli and Mercadante 2.5 to 3.0. Leaching is another important factor (2010) show a simplified mechanism of the that could have led to loss of vitamin C along overall changes occurring in carotenoids during with the water activity during the preparation and heating. The degradation of β-carotene decreases drying process (Kirimire, 2010). Moreover, the the nutritional value of vitamin A and its activity relatively higher moisture content in the solar as an antioxidant, and causes significant loss of tunnel dried samples than in the electrical cabinet the natural flavor and chromophores in foods. dried samples could have contributed to their Ultimately, the food products are less acceptable relatively higher vitamin C degradation. Vitamin C to consumers. In food industries β-carotene can stability is reduced in aqueous state than in the also be added to some commercial fruits and dry state (Kirimire, 2010). Vitamin C retention is vegetables beverages (Rodrίguez-Comesana et also improved by all drying processes under an al., 2002). Thus, in order to maintain the high inert atmosphere, which reduces the presence of quality of nutrition and flavor of products, it is O2 as evidenced in tunnel dried samples. Similar particularly important to protect β-carotene effect of the drying methods in vitamin C were during processing and storage. Generally, vitamin also reported in mango (Kabasa et al., 2004), A is essential for growth and development, vegetables (Kirimire, 2010) and tomato immune system and vision. Krinsky and Jonson (Perumal, 2009). (2005) reported that β-carotene is an important chain-breaking antioxidant which scavenges lipid Physically, vitamin C functions as an effective oxide radicals. However, pro-oxidant actions in water-soluble antioxidant that readily scavenge this context of lipid peroxidation have also been reactive oxygen species (ROS) and also a factor described as an exposure of β-carotene to in numerous physiological reactions, including the oxidizing conditions in high oxygen levels leading post-translational hydroxylation of proline and to increased markers of lipid peroxidation (El- lysine in collagen and other connective tissue Agamey et al., 2004). proteins, collagen, collagen gene expression, synthesis of norepinephrine and adrenal The differences in vitamin C degradation between hormones, activation of many peptide hormones, the drying methods could be influenced by and synthesis of carnitine (Johnstone et al., temperature, dying kinetics and water activity. 2007). Also, it is apparently shown that, one The higher temperature in the tunnel dryer would need to consume large quantities of dried inactivated the ascorbic acid oxidase and offered fruits and vegetables to meet RDA of 75 and 90 vitamin protection towards enzymatic oxidation mg/day for women and men respectively and (Leong and Oey, 2012). In addition to enzymatic 45mg/day for children 9-12 years old (USDA, 11 Runyogote
2010). Moisture loss or uptake is one of the most becomes safe and stable. On the other hand, important factors that control the shelf life of reduction of water activity in final product is a foods. As water activity in a foodstuff decreases, very important factor to ensure the stability of the number and growth of microbial species able the dried foods which means final product with to grow in that environment also decreases (Idah low water activity is safe from enzymatic spoilage and Aderibighe, 2007). From the results it has because active water is not available for microbial been observed that all the products developed growth (Chieh, 2006). Therefore, dried products had the water activity >0.6 This means that, having the moisture content of 20% and a water below this limit no microbial proliferation can activity of 0.7 or bellow tend to be resistant to occur, browning is minimized and the product microbial deterioration (UNIDO, 2001). Table 7. The effect of drying methods on mineral content (mg/ 100 g) of each dried product Products BP BT MB MD MP PS MBP Data presented as arithmetic means ± SD (n = 2). Means in column of each product with different Dryer type Electrical Tunnel Electrical Tunnel Electrical Tunnel Electrical Tunnel Electrical Tunnel Electrical Tunnel Electrical Tunnel Ca Na Fe P K 91.7±3.4a 96.2±3.0a 85.1±3.4a 90.2±3.4a 84.5±3.8a 81.7±3.0a 76.1±3.4a 83.0±3.4a 93.8±3.4a 108.2±3.4a 105.8±3.0a 98.6±3.4a 55.7±3.4a 54.9±3.4a 62.4±0.4a 63.5±0.1a 60.4±0.3a 61.5±0.3a 60.7±0.7a 60.2±0.0a 60.8±0.3a 60.6±0.3a 59.1±0.3a 61.5±0.3a 60.9±0.3a 60.1±0.1a 59.2±0.1a 59.7±0.4a 2.4±0.2a 2.2±0.0a 2.4±0.0a 2.4±0.0a 2.2±0.0a 2.0±0.3a 2.3±0.0a 2.2±0.0a 2.2±0.0a 2.2±0.0a 2.3±0.0a 2.1±0.0a 2.2±0.0a 2.2±0.0a 43.9±0.3a 44.6±0a 46.8±0.3a 42.7±0.0a 42.5±0.3a 42.3±0.0a 42.0±0.3a 43.5±0.3a 42.3±0.0a 42.7±0.0a 42.3±0.0a 43.9±0.3a 42.0±0.3a 41.8±0.0a 725.9±7.5a 761.9±7.3a 811.7±7.3a 729.4±7.3a 708.8±7.3a 703.6±7.3a 650.2±7.3a 590.5±6.5a 739.7±7.3a 654.2±7.3a 626.5±7.3a 631.7±7.3a 796.3±7.5a 744.9±7.3a superscript letters are significantly different at p<0.05. Key ; BP is mixed banana and pineapple, MB is mixed mango and banana, BT is dried banana, MD is dried mango, MP is mixed mango and pineapple, PS is dried pineapple and MBP is mixed mango, banana and pineapple. Minerals contents. The variation in the dryer type was The effect of drying methods on mineral content insignificant at (p>0.05). (mg/ 100 g) of each dried product is shown in Table 7. There were no significant (p>0.05) Potassium was the most abundant mineral while differences in mineral content between samples iron was the least available mineral in all of the dried by both methods (Electrical cabinet dryer dried and fruit leather samples. This is and solar tunnel dryer). Potassium was the most comparable to the findings obtained in other abundant mineral while iron was least abundant studies in various fruits and vegetables example of all minerals (Table 7). The variations in the apples (Lowor and Adyente-Badu, 2009), drying methods were also insignificant (p>0.05) vegetables (Iqbal et al., 2006) and Amaranthus this is due to their stability on heat. (Mepba et al., 2007). There were slightly variations in the mineral contents with the The effect of drying methods on mineral content exceptional of phosphorous and iron. The (mg/ 100 g) of each fruit leather has been observed variation might have resulted from indicated in Table 8. The results show that there species, variety, genetic, geographic, climatic, are no significant differences (p>0.05) in mineral environmental condition, agronomic factor and content within the sample. Potassium had the seasonal variations (Gul and Safdar, 2009; highest values while iron had the lowest mineral Adepoju, 2012). The observed insignificant 12 Runyogote
differences in all mineral contents between the metabolism and maintenance of the drying methods indicate that, solar drying and electrochemical balance that allows nerve cells electrical cabinet temperatures had little or no to transmit impulses and muscles to contract effect on mineral contents of the dried products (Dickinson, 2002). The findings revealed that, as well as the fruit leather. Most minerals have one would need to consume 574-642g of dried fairly low volatility at high temperatures of up mango, 386-422 g of dried banana, 918-920 g 550-600oC which means, the solar drying and of dried pineapple to meet the RDA of electrical cabinet air temperatures are of little 470g/day set by USDA (2010). It has also been consequences for their contents (Nielsen, 2010). reported that, fruits are generally poor sources Fruits are important sources of minerals in of iron (Mepba et al., 2007) which suggests human diet which are important for vital body consumption of large quantities of fruits will functions such as acid base and water balance. meet the Recommended Daily Allowance (RDA) Potassium is necessary for bone health, energy of 45 mg/day. Table 8. The effect of drying methods on mineral content (mg/ 100 g) of each fruit leather Products BMS MBL ML MPL PMD Data presented as arithmetic means ± SD (n = 2). Means in each column for each product with different Dryer type Electrical Tunnel Electrical Tunnel Electrical Tunnel Electrical Tunnel Electrical Tunnel Ca Na Fe P K 67.3±3.8a 65.6±3.4a 55.1±3.4a 56.3±3.4a 55.8±2.0a 59.3±3.4a 57.7±2.0a 56.6±3.4a 69.8±3.4a 65.7±3.4a 60.3±0.1a 62.4±0.1a 61.4±0.1a 60.5±2.3a 63.3±0.1a 58.9±0.0a 63.4±0.3a 59.6±0.3a 59.6±0.3a 61.6±0.4a 2.1±0.0a 2.3±0.2a 2.4±0.4a 2.3±0.2a 2.1±0.0a 2.4±0.0a 2.2±0.0a 2.2±0.0a 2.2±0.0a 2.2±0.0a 42.0±0.3a 43.0±0.3a 41.6±0.3a 42.0±0.3a 42.3±0.0a 41.8±0.0a 42.3±0.0a 42.5±0.3a 42.3±0.0a 43.5±0.3a 667.3±7.3a 659.1±7.3a 657.9±7.3b 664.8±8.9a 6840.5±7.3a 688.3±7.3a 689.3±7.3a 708.8±7.3a 679.9±7.3a 688.3±7.3a superscript letters are significantly different at p<0.05. Key: Mixture of banana and mango leather (BMS), mixture of mango and banana leather (MBL), mango leather (ML), mixture of pineapple and mango leather (MPL) and mixture of mango and pineapple leather (PMD). Shelf life of the developed product Microbial load Dried fruits The effect of drying methods and storage time on microbial quality of dried fruits is shown in Fig.4-6. The results show significant variations (p<0.05) in microbial load between drying Fig. 4. Effects of drying methods on total methods. Samples dried by tunnel dryer had bacterial count (cfu/g) in dried fruits lower total bacterial count, moulds and yeast than the samples dried by electrical cabinet dryer. The effect of storage time on microbial load was also significant (p<0.05). The fourth month storage time resulted into higher microbial load in sample BTE (Total bacterial count), BTG, MDE, MDG, and PSE while sample PSG, MDE (moulds) and BTE (Yeast) no Fig. 5. Effects of drying methods on moulds microbial loads were seen (Fig. 4-6). (cfu/g) in dried fruits 13 Runyogote
Fig. 9. Effects of drying methods on yeast (cfu/g) Fig. 6. Effects of drying methods on yeast (cfu/g) in mixed dried fruits in dried fruits Fruit leather Mixed dried fruits The effect of drying methods and storage time on The effect of drying methods and storage time on microbial quality of fruit leather is shown in Fig. microbial quality of mixed dried fruits is shown in 10-12. The results had significant variations Fig.7-9. The results indicated significant (p<0.05) in microbial load between drying variations (p<0.05) in microbial load between methods. The fourth month storage time had drying methods. Samples dried by solar tunnel higher microbial loads (Fig. 10-12). dryer had higher total bacterial count, moulds and yeast than the samples dried by electrical cabinet dryer this was due to the electrical cabinet dryer being constructed inside the house unlike the solar tunnel dryer which was in an open space, in which its hygienic condition could have been compromised by the external features like the blowing of wind. The fourth month storage time resulted into higher microbial loads Fig.10. Effects of drying methods on total with the exception of samples MBE (moulds and bacterial count (cfu/g) in fruit leather yeast), BPE (moulds), MBG (moulds) and MPE (moulds) which showed no microbial growth. Fig. 7. Effects of drying methods on total Fig. 11. Effects of drying methods on moulds bacterial count (cfu/g) in mixed dried fruits (cfu/g) in fruit leather In all samples no coliforms were observed and this signifies that all snacks formulated were safe for consumption since coliforms are commonly used as the indicators of unsanitary conditions in the food processing unit (Jayaraman and Das- Gupta, 2006). Removal of water activities Fig. 8. Effects of drying methods on moulds increases the solute concentration of the food (cfu/g) in mixed dried fruits system and thus reduces the availability of water 14 Runyogote
for microorganisms to grow. The recommended Mercado, 1996). Therefore, in order to come up maximum limit of water activity for specific with shelf-life stable dried product good hygienic microorganisms to grow as reported by Perumal practices should be followed including adequate (2009), include; fungi the limit is below aw = 0.7 training on GMPs and GHP to food handlers and (20% moisture content) while most yeast and processors coupled with effective applications of bacteria are inhibited at water activity below aw hazard analysis critical control point (HACCP) in = 0.8 and 0.9 respectively. For complete the production chain to advocate safe end microbiological stability, water activity of the products. system should be below 0.6, where below this value, most microbial growth especially bacterial Conclusion is impended with the exception of xerophillic The study has shown that both drying methods moulds and osmophillic yeast which can thrive at had substantial levels of required nutrients one will water activity of 0.61 (Jayaraman and Das- need for health life. It was also observed that the Gupta, 2006). use of drying technology in agricultural sector to conserve seasonal fruits could be the best alternative approach to ensure the availabilities of fruits yearly in developing countries. Therefore, in order to come up with safe and good finished dried products, good manufacturing practices, good hygienic practices, HACCP system, choice of drying methods and operations that will retain required nutrients should be considered in the production chain for higher consumer acceptability and Fig. 12. Effects of drying methods on yeast economical point of view. (cfu/g) in fruit leather The developed products (snacks) had the Moreover, the survival, number and type of acceptable range of moisture content and water microorganisms during and after drying depends on activity which allowed the products to be shelf life the initial microbial quality of fresh produce, pH and stable throughout the study period of four months. composition, pre-treatments, drying time, methods Furthermore, the absence of coliforms was an of drying, moisture content of the final product and indicative of sanitary conditions that contributed to the good manufacturing practices (GMP) and the shelf-life stability of the developed products. general hygienic practices during processing and Therefore, in view of these results, it can be drying (Sagar and Suresh, 2010). Also, the concluded that solar tunnel dryer is the best drying interaction of some factors such as water activity, technology for agriculture produces in developing temperature-time combination, pH, oxygen, carbon countries due to its economic use, retention of the dioxide and chemical preservatives have an nutrients and prolonging shelf life of dried important effect on the inhibition of microbial products. growth during drying period (Fellows, 2009). References Generally, the results have shown the potential of Adepoju O, Sunday T, Edwin B, Folaranmi drying in extending shelf life of the developed OA. 2012. Nutrient composition and contribution product and thus minimizing the post-harvest of plantain (Musa paradisiaca) products to dietary losses. However, drying alone does not kill the diversity of Nigerian consumers. African Journal microorganisms (Barbosa-Canovas and Vega- of Biotechnology 11(71), 13601-13605. 15 Runyogote
Ajay C, Orsunil KS, Deepak DP. 2009. Design El-Agamey A, Lowe GM, McGarvey DJ, of solar dryer with turboventilator and fireplace. Mortensen A, Phillip DM, Truscott TG, Young [www.solarfood.org/solarfood/Solarfood] site AJ. 2004. Carotenoid radical chemistry and visited on 02/04/2024. antioxidant/pro-oxidant properties. Archives of AOAC. 1995. Official methods of analysis. Biochemistry and Biophysics 430, 37-48. Association of Official Analytical Chemists. Eze JI, Agbo KE. 2011. Comparative studies of Washington D.C., USA. sun and solar drying of peeled and unpeeled ginger. American Journal of Scientific and Barbosa-Cánovas GV, Vega-Mercado H. 1996. Industrial Research 2(2), 136-143. Dehydration of Foods. New York, NY: Chapman and Hall. [www.docentes.unal.edu.co/.../docs/Tecnicas%2 Fellows PJ. 2009. Food processing technology, 0de%20Preservacion.pdf] site visited on Principles and Practice (3rd edition). Woodhead 20/08/2024. Publishing Limited, Oxford, England, 913pp. Barrett DM. 2007. Maximizing the nutritional Funebo T, Ohlsson T. 1998. Microwave-assisted value of fruits and vegetables. Journal of Food air dehydration of apple and mushroom. Journal Technology 61(4), 40-44. of Food Engineering 38, 353-367. Borsarelli CD, Mercadante AZ. 2010. Thermal Gul S, Safdar M. 2009. Proximate composition and photochemical degradation of carotenoids. and mineral analysis of cinnamon. Pakistan In: Landrum JT (Ed), Carotenoids: Physical, Chemical, and Biological Functions and Journal of Nutrition 8(9), 1456-1460. Properties. CRC Press, Boca Raton, USA, 229- 253. Idah PA, Aderibigbe LA. 2007. Quality changes in dried tomatoes stored in sealed polythene and Chieh C. 2006. Water Chemistry and open storage systems. Electronic Journal of Biochemistry. In: Food Biochemistry and Food Practices and Technologies 10, 123-136. Processing, edited by Hui YH. USA: Blackwell. Iqbal M, Hanif R, Iqbal Z, Hanif S, Rasheed Damodaran S. 2008. Amino acids, peptides, and M. 2006. Evaluation of a solar crop dryer for rural proteins. In: Food Chemistry 4th Edition, edited application in Nigeria. Botswana Journal of by Damodaran S, Perkin KL, Fennema OR. CRC Technology 11(2), 58-62. Press, Boca Raton, FL, 217-329. Delia B, Mieko K. 2004. Harvest-plus handbook ISO 4833. 2003. for Carotenoid Analysis. Harvest-plus, DC and [https://law.resource.org/pub/eac/ibr/eas.68.1.2 Cali: International Food Policy Research Institute 006.pdf] site visited on 08/08/2024. (IFPRI) and International Center for Tropical Agriculture (CIAT), 35-36. ISO 6611. 2004. Technical Committee ISO/TC 34, Food products, Subcommittee SC 5, Milk and Dickinson A. 2002. Recommended Intakes of milk products, and the International Dairy Vitamins and Essential Minerals. Council for Federation (IDF), in collaboration with AOAC Responsible Nutrition (CRN). International. Published by ISO and IDF and [http://www.crnusa.org/benpdfs/CRN012beneftsˍ separately by AOAC International. recs.pdf] site visited on 13/08/2024. 16 Runyogote
ISO 7251. 2005. Krinsky NI, Jonson EJ. 2005. Carotenoids actions and their relation to health and disease. [http://www.iso.org/iso_catalogue/catalogue_tc/c Molecular Aspects Medicine 26, 459-516. atalogue_detail.htm?csnumber=34568] site visited on 20/04/2024. Leong SY, Oey I. 2012. Effects of processing on anthocyanins, carotenoids and vitamin C in ISO 7251. 2007. Technical Committee ISO/TC summer fruits and vegetables. Food Chemistry 34, Food products, Subcommittee SC 9, 133, 1577-1587. Microbiology. [https://law.resource.org/pub/eac/ibr/eas] site Lowor ST, Agyente-Badu CK. 2009. Mineral visited on 23/03/2024. and proximate composition of cashew apple (Anarcadium occidentale L.) juice from Northern Jayaraman KS, Das Gupta DK. 2006. Drying of Savannah, Forest and Coastal Savannah regions Fruits and Vegetables; Handbook of Industrial in Ghana. American Journal of Food Technology Drying, Third Edition, CRC Press Taylor and 4, 154-161. Francis Group, 200pp. MACF. 2009. Post-harvest technologies for Johnston CS, Steinberg FM, Rucker RB. 2007. preparation, processing and utilization of fruits Ascorbic acid. In: Handbook of Vitamins, 4th ed. and vegetables. Makanza Creative Art (MCA), Dar CRC Press, Boca Raton, FL, USA, 489-520. es Salaam, Tanzania, 89pp. Makanjuola OM, Sanni HA, Ajayi A. 2013. Kabasa JD, Ndawula J, Byaruhanga YB. 2004. Effects of blanching and frozen storage on the Alterations in fruit and vegetable β-carotene and proximate composition of four leafy vegetables vitamin C content caused by open-sun drying, widely consumed in Ilaro community. Journal of visqueen-covered and polyethylene-covered Global Biosciences 2(4), 85-89. solar-dryers. African Health Science 4(2), 125- 130. Mepba HD, Eboh L, Banigo DEB. 2007. Effects of processing treatments on nutritive composition Kalt W. 2002. Health functional phytochemicals and consumer acceptance of some Nigerian of fruits. Horticulture Review 27, 269-315. edible leaf vegetables. African Journal of Food, Agriculture, Nutrition and Development 7(1), 1- King’ori B, Wanjohi E, Gachoki I, Maina P. 18. 1999. Fruit and vegetable drying. Processing of tree crops products. A farmer trainer training Methakhup SM. 2003. Effects of drying methods manual, GTZ-ITFSP. and conditions on drying kinetics and quality of [www.gtzeecrops.org/Downloads/Manuals/Proces Indian gooseberry. MSc Dissertation, King sing/Module3.pdf] site visited on 02/05/2024. Mongkut’s University of Technology Thonburi, 96pp. Kirimire BT, Musinguzi E, Kikafunda JK, Lukwangu FB. 2010. Effects of vegetable drying Mongi RJ. 2013. Drying of fruits and vegetables: Studies on dryer’s thermal performance, quality techniques on nutrient content: A case study of and shelf-life of dried mango, banana, pineapple, south-western Uganda. African Journal of and tomato. PhD Thesis, Sokoine University of Science, Agriculture, Nutrition and Development Agriculture, Morogoro, Tanzania. 10(5), 2585-2600. 17 Runyogote
Morris A, Barnett A, Burrows O. 2004. Effect Sagar VR, Suresh KP. 2010. Recent advances in drying and dehydration of fruits and vegetables: a review. Journal of Food Science and Technology 47(1), 15-26. of processing on nutrient content of foods. Cajarticles 37(3), 160-164. Santos PHS, Silva MA. 2008. Retention of vitamin C in drying processes of fruits and vegetables- A review. Drying Technology 26(12), 1421-1437. Nielsen SS. 2010. Food Analysis Laboratory Manual. Food Science Text Series, ISBN: 1441914625, 171pp. Tomohiro S. 1990. Determination of vitamin C (ascorbic acid) by Indophenol method. In: Laboratory Manual for Food Analysis. Jomo Kenyatta University College of Agriculture and Technology, Kenya, pp.49. UNIDO. 2001. Deteriorative reactions in dried fruits and [http://www.unido.org/fileadmin/import/32144_3 2.deteriorativereactionsS.15.pdf] site visited on 13/5/2024. United Republic of Tanzania (URT). 2004. Poverty Reduction Strategy: The Third Progress Report 2002/03. Government Printer, Dar es Salaam, Tanzania. Novasina. 2010. User Manual LabSwift-aW. [www.novasina.com] site visited on 02/06/2024. Perera CO. 2005. Selected quality attributes of dried foods. Journal of Drying Technology 23(4), 717-730. vegetables. Perumal R. 2009. Comparative performance of solar cabinet, vacuum-assisted solar, and open sun drying methods. MSc Dissertation, McGill University, Montreal, Canada, 100pp. Runyogote J, Chacha M, Ndabikunze B, Raymond J. 2021. Optimized method for processing avocado seeds to improve selected Wargovich MJ. 2000. Anticancer properties of fruits and vegetables. Horticultural Science 35, 573-575. nutrients and functional values. Food Science and Technology Research 27(1), 75-84. https://doi.org/10.3136/fstr.27.75 18 Runyogote