Download
1 / 29
290 likes | 383 Views
The International Society of Orthopaedic Centers (ISOC) Metrics Collaboration Project convenes to discuss performance metrics and best practices. CEOs collaborate to identify top metrics and align data collection processes across six key areas. The meeting agenda includes breakout sessions and consensus-building activities.

E N D
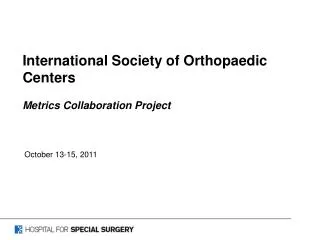
International Society of Orthopaedic Centers Metrics Collaboration Project October 13-15, 2011
Agenda 8:00 a.m.-10:00 a.m. • Overview of work since last meeting 8:00-8:20 • Discussion questions 8:20-8:25 • Break out groups 8:25-8:55 • Report out: Group 1 8:55-9:10 • Report out: Group 2 9:10-9:25 • Consensus 9:25-10:00 2
ISOC CEO Metrics Collaboration • Quote from article… • “The CEOs decided to take on an interim project to identify best practices for collecting data around performance measurement, both clinically and operationally” • Question to be answered… • Is sharing performance metrics a good starting point for ISOC CEO collaboration? 3
Process • Members asked to submit the top 1-3 metrics considered most important for tracking and reporting performance across six subject areas: • Operations • Quality and Safety • Patient Experience • Employee Satisfaction • Financial Performance • Research and Teaching 4
Process (Continued) • Evaluated responses for Alignment • A total of 48 metrics were identified • Eliminated metrics that were only reported by a few institutions or were overlap metrics, e.g. many different metrics around patient satisfaction • Eliminated 4 financial metrics due to differences in country reimbursement systems 5
Top Metrics • 8 metrics which were reported by six or more institutions as one of the “top” metrics for tracking performance • In some cases, definitions are same, for others, there is variation. This will be among the items to be discussed/addressed 6
Patient Experience Variations on one of the top metrics 11
Employee Satisfaction Variations on one of the top metrics 12
Research and Teaching Partial variation on one of the top metrics 13
Financial 14
Key Questions for Discussion • Is there value in collaborating regarding metrics? • Will comparison of operational and performance metrics allow for meaningful collaboration and facilitate improvement efforts? • How do we go about utilizing the dashboard for improvement efforts? • How do we go about conducting the analysis in a way that ensures we are comparing the same thing? • Should we use the same definition? • Should we measure using greater level of detail? (i.e. more specific such as Average Length of Stay for unicondylar knee replacement) • What’s missing? • Are there top metrics missing from the chosen areas which we should add? • Are there any additional subject areas from which we should include metrics? • How would we support data collection? How should we make this operational? 15
Draft Breakout Groups • Group 1 • Lou Shapiro (Lead) • Luis Ibarra • Matthias Spielmann • Peter Hoppener • Elena Botinelli • Robert Cusack • Rob Hurd • Group 2 • Pelle Gustafson (Lead) • Maricela Verdejo • Alejandro de Marinis • Sibylle Stauch-Eckmann • Stefano Liverani • George Hernandez • Laura Robbins 16
Appendix 1. McKinsey Hospital Institute: Time permitting we may review the following slides2. Metric Submission: Metric work sheets included for information 17
McKinsey Hospital Institute • McKinsey Hospital Institute (MHI) is the part of McKinsey & Company focused on increasing performancetransparency and generating lasting impact for providers • MHI is built on the foundation of McKinsey & Company,delivered in a highly affordable, non-invasive, high impact way • MHI provides consulting and tools in an ongoing relationship • Granular analytics to quantify and prioritize opportunities • Benchmarks and best practices • Implementation support and capability building • Best-in-class tools for ongoing tracking and monitoring • MHI supports providers over time across their most important issues: • Operating at Medicare Margins • Physician alignment, strategy and performance • Strategic planning under uncertainty 19
Potential Dashboard Options Increasing (>10%) Above target Stable (10% to -5%) Equivalent (-5% to 0) Decreasing (< -5%) Below target (< -5%) Representative ISOC Group Dashboard 21
Potential Dashboard Options Increasing (>10%) Above target Stable (10% to -5%) Equivalent (-5% to 0) Decreasing (< -5%) Below target (< -5%) Representative ISOC Member Dashboard 22