Download
1 / 25
320 likes | 967 Views
Learn about the Demographic Transition Theory (DTT) describing fertility and mortality trends from traditional to modern societies. Explore its stages, evaluation, and applicability.

E N D
THE DEMOGRAPHIC TRANSITION THEORY Dr. J. Kivelia Department of Geography UNIVERSITY OF DAR ES SALAAM
Outline • Concept of Demographic Transition • Stages of the Demographic Transition Theory • Evaluation of the Theory • Applicability of the Theory • Food for thought
THE DEMOGRAPHIC TRANSITION THEORY Demographic Transition Theory (DTT): is a description of the observed long-term trends in fertility and mortality it argues that vital rates (births and deaths) change from high to low levels following modernization DTT observes that in traditional societies fertility and mortality was high. In modern societies fertility ad mortality are low. In between there is the demographic transition. The first proponent of the theory was Thompson in 1929; improved by Davis (1945); Notestein in 1945 and in 1954; and Demeny in 1972.
Contd. The precise timing of DTT is varied with respect to both date of onset and duration in the different countries experiencing it. In Europe it began in the late 18th century when there was a general improvement in mortality in the society. By the end of World War II North & Western Europe + North America had reached low levels of fertility. The rest of the world followed in the post war era. Currently, nearly all developing countries are experiencing changes in mortality but fertility is still high.
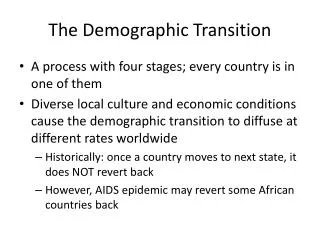
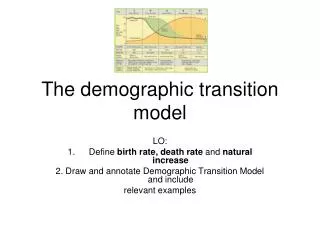
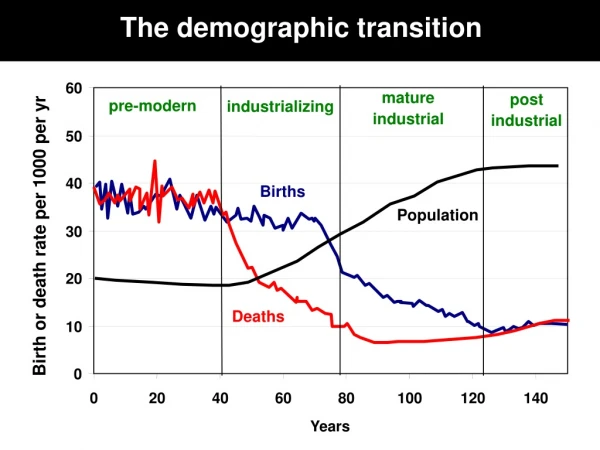
Stages of Demographic Transition DTT is usually described according to three or four main stages. Sometimes in seven stages The three stages are described thus: Stage 1 begins with relatively low rates of population growth because of high birth and death rates(stage 1 in Fig. 1 above) Stage 2 is when stage 1 is followed by rapid population growth as the death rates decline, but birth rates remain high (stages 2 – 4 in Fig. 1 above) Stage 3 where population returns to low growth because of reduction in fertility (Stages 5 – 7 in Fig.1)
Stages (cont’d) The four stages are described thus: Stage 1 begins with relatively low rates of population growth because of high birth and death rates (stage 1 in Fig. 1 above) Stage 2 is when stage 1 is followed by significant population growth as the death rates starts to decline, but birth rates remain high (stages 2 – 3 in Fig. 1) Stage 3 is when death rates have stabilized at low levels and birth rates have started to decline (stage 4 - 5 in Fig.1) Stage 4 is when population returns to low growth because mortality and fertility has stabilized at low levels (Stages 6 – 7 in Fig.1)
Stages (cont’d) The seven stages are described thus: Stage 1: is a stage of potential growth which: Combines high birth rates with high death rates. Death rates tend to fluctuate on either side of the birth rate at times allowing some growth, and at other times wiping off the achieved growth. Period was predicated by Rev. Thomas Malthus
Contd. During this period many persons are born and many die young large numbers are wasted in infancy. The life expectancy is low - about 30 years. The growth rate is very low The increase in population numbers is therefore maintained at low levels.
Contd. In this sense the population is stable although at a high cost of human life. Population sizes tend to be in equilibrium with their habitats resources by not increasing the demands or by exploiting them slowly. Such populations are potentially explosive for any substantial decrease in death rates especially infant mortality which converts the potential for growth into actual growth.
Contd. Stage 1 conditions existed during the period of hunters and gatherers. However, there are observations that: among Eskimos in Canada infanticide was practiced, and, among the Aborigines in Australia operation of the male urethra was made to control population and resources. Critical questions are: Do these observations suggest high fertility coupled with high mortality? Could the hunter-gatherer lifestyles allow for high fertility?
Contd. Overall, in the potential growth stage (stage 1) the population has low standard of living for they use poor tools and the means of livelihood is purely subsistence. Stage 1 is therefore summarized as a stage of low level of economic development coupled with: High fertility High mortality Low life expectancy at birth (about 30 years) Low, stable growth rate
Stage 2: Incipient Growth Stage 2 combines persistently high birth rates with death rates that have began to decline. Societies have started to improve medicine, nutrition and sanitation. Those who are born survive because infants are the ones which lower death rates. Life expectancy for others start to age up (increase)
Contd. Due to lower infant mortality the age structure of the population changes by having more young population. The declining of the death rates is the beginning of population explosion. The burden of productive middle ages increases because the dependency ratio has increased.
Stage 3: Transitional growth The stage of incipient growth continues to a critical stage of rapidpopulation growth (population explosion) This stage combines stubbornly high birth rates with death rates that have dropped very substantially. Large numbers are born and death rates are so low that the vast majority survive infancy. Consequently, life expectancy increases significantly.
Contd. The proportion of children grows and the reduced mortality appears in the whole population structure. This pattern is common in developing countries, particularly in Africa, Southern America and some countries in Eastern and Southern Asia. This is the result of an increase in the use of modern contraceptives and improvement in social services like education.
Stage 4: Incipient decline Stage 3 follows gradually from stage 2. In the beginning, the birth rates begins to decline towards a fairly low and relatively stable death rate that no longer has the potential to drop greatly. The population becomes nearly stationary. However, in this incipient stage, it is still a long distance to reach a stable equilibrium between fertility and mortality.
Contd. It is observed in present China, India, Indonesia, Brazil and other newly industrialized countries like Thailand, Taiwan, Hong Kong, Singapore.
Stage 5: Controlled Growth The birth rates drop to very low levels and a vast proportion of couples are planning their families and avoiding unwanted pregnancies. Growth still goes on because of the inherent population growth momentum (TFR) is about 2.1 or 2.2 per couple necessary for Zero Population Growth (ZPG), but the total numbers of children produced is higher because of the age structure (more women entering their reproductive age than those leaving it)
Contd. The system pulls closer to a stable equilibrium between fertility and mortality. Life expectancy increases significantly. Summarised as a stage of high level of socio-economic development characterized by: Low mortality Low fertility High life expectancy Experienced in Eastern Europe. Australia, Cuba, Uruguay, Southern Europe, USA and others
Stage 6: Equilibrium at Zero Growth The demographic transition has death rates near to some irreducible minimum and fertility rates that vary slightly on either side of mortality levels over a short period. A stage of zero population growth Low levels of fertility are influenced by attitudes of women and society in general. Observed in some European countries, but countries like USA are not yet at zero growth rate
Stage 7: Absolute decline The last logical stage of demographic transition occurs when the birth are consistently below the death rates. The number of people is decreasing every year, resulting to absolute decline or negative growth rate. In the 1980s the absolute decline stage was limited to West Germany and Switzerland. In some countries the absolute decline may be averted by immigration.
Evaluation of the Theory The migration variable- focuses on natural increase and leaves out the role of immigration into the society and emigration out of the society. Western bias- modeled out of what happened in Western Europe which are highly industrialized countries. Time difference-The amount of time needed to lower birth rate appreciably is so variable-its speed is very different.
Applicability of the Theory Applicable in developed countries. How about LDCs? Have passed stage 1 due to improved health conditions – nutrition, hygiene, medical technologies, etc. But, are these from developments in LDCs? Are now in stage 2, high fertility But: Does the prevailing socio-economic conditions advocate for lowering fertility? When will LDCs reach a stage of both low mortality and fertility, i.e. low and stable population growth?
Examine the applicability of the DTT in DCs and LDCs Comment on the factors that facilitated the demographic transition in DCs and LDCs