Download
1 / 13
130 likes | 222 Views
This workshop overview discusses the benefits and implications of sparse vs. dense array setups for low-frequency arrays like LOFAR and SKA-Low, covering topics such as station calibratability, beam effects, array cost, and peak sensitivities. Various antenna basic concepts and calibration limitations are also explored.

E N D
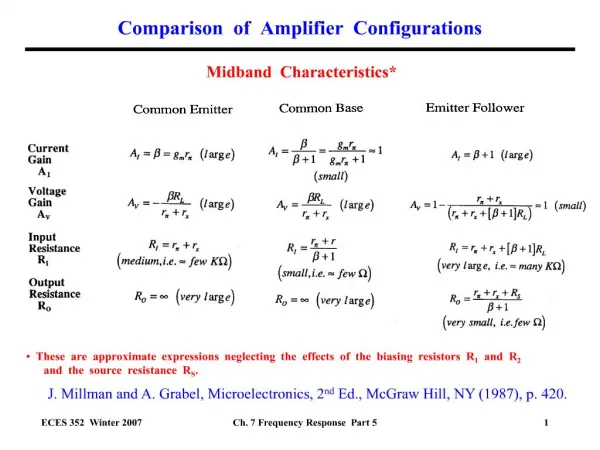
Performance of station array configurations Sparse vs. Dense, Regular vs Random Jaap D. Bregman AAVP Workshop,Cambridge, 2010-12-09
Overview Setting the Scene for SKA-Low Some Antenna Basic Why Sparse Arrays for F < 300 MHz LOFAR 20 – 240 MHz (sparse, regular & random) Station & Array Calibratability Element & Sparse Array Beam EM-coupling effects Vivaldi Element & Array (dense regular) Antenna Cost Extrapolation Peak sensitivities for SKA Low Balancing Lowest against Highest frequency octave Conclusions (combine)
Setting the Scene for SKA-Low Memo 125 defines SKA1 with 2 Synthesis Arrays 100 M€ for AA-Low 70 – 450 MHz 2000 m2/K @ z = 10 100 M€ for Dishes 0.3 – 10 GHz 1000 m2/K 0.45 – 3 GHz Effective supporting surveys requires 30% of cost in Receivers, Beamforming, Correlation & Imaging 70% of cost in collecting area & Low Noise Amplifier What could we do with 70 M€ in view of Limitations set by the Sky Limitations set Antenna Theory Limitations set by Ionosphere calibration Limitations set by Station Beam calibration
Some Antenna Basic Array has set of N antenna element separated by a pitch P When l/2 > P we are in the dense regime and Ae = N P2 = N lp2/4 A dense array has a projected area ~ cos(q) with zenith angle q A dipole above a ground plane has a beam pattern ~ cos(q) in H-plane and ~ cos2(q) in E-plane, A free dipole above ground has Ae = l2/W with beam solid angle W ~ 3 In the sparse regime are the pitch cells not fully filled so Ae < P2 and lsparse < (3/4)1/2 P A dipole with length L and height H above a ground plane has below resonance impedance Z ~ 377 L H / l2(real part) The EM coupling between the elements in the dense regime increases the effective impedance in a dense array, which is important to get appropriate matching to low noise amplifiers
Why Sparse Arrays for F < 300 MHz Sparse Array stations have Aeffective < Aphysical Ae ~ N l2 / W Tsky ~ l2.6 Sensitivity Ss ~ Ts / Ae ~ l0.6 Typical source flux So ~ l0.6 Source Count N(S > So) ~ So-1 Beam solid angle W = l2 / Ap So constant detection sensitivity But sources/beam ~ l-2 Expo-Shell configuration Exponential decreasing element separation towards centre of station LBA 50% subsets of LOFAR Select 50% of elements to limit sparseness at higher frequencies 30 MHz subset 60 MHz subset
LOFAR 20 – 240 MHz Two different sparse array configurations Randomized expo-shell for 96 elements 20 - 80 MHz 24/48/96 Tiles with 16 elements on regular grid 120 - 240 MHz Two different dipole like elements Free standing thin wired short inverted V-dipole Boxed Vertical bowtie as fat dipole Both above ground plane Descent receiver noise match LBA sky noise limited 30 - 60 MHz HBA sky noise limited 120 - 180 MHz
Station & Array Calibratability VLA 75 MHz could not be selfcalibrated A single single source available in only a few fields Ae/Ap = 0.15 is too small Beam too wide, 25 m dish to small for ionosphere patch size 1.5 MHz bandwidt not enough with 10 sec to match ionosphere LOFAR will do full ionosphere multi direction selfcal 40 m remote stations allow multi direction at 120 MHz 30 m core stations could provide combined solution for core 56 m international stations still see partly resolved calibrators 10 MHz, 10 sec, allows for ~20 directions when Ae/Ap = 1.0 33 m station at 60 MHz Ae/Ap = 0.47 reasonable ionosphere needed 83 m station at 30 MHz Ae/Ap = 0.29 good ionosphere needed
Element & Sparse Array Beam Include EM Coupling Pitch < few wavelength Element beam gets ~30 % bumps Every element beam is “different” Effective Station Beam Average element beam depends on direction in which array is pointed Also for element impedance to which LNA needs to matched Average element pattern has blind angles for specific freq & directions Especially for regular array Array factor has grating lobes Randomization reduces both effects • Ignore EM Coupling • True in very sparse arrays • True for arrays like WSRT • Not true for ATA • Effective Station beam • Product of element beam and “array factor” • Element beam is smooth • Array factor has side lobes • Array factor has grating lobes • Array factor independent of direction where it is pointed to
Vivaldi Element & Array Free Vivaldi is wide band At least 3 octaves However narrow beam Array of connected elements Good impedance P/2 < l/2 < 4 P Constant Ae = Ap for l > P 3-1/2 Cos (q) “element” beam l/2 > P Narrower “element” beam l/2 < P In sparse regime Ae/Ap ~ l2 Array factor has grating lobes No grating for q < 47o at l = P 3-1/2
Antenna Cost Extrapolations LOFAR Actuals Free LBA element (~2 m) € 150 Container + Combiner + Cables € 500 5*5 m2 Tile + Combiner + Cables € 1800 Embedded HBA element + delay € 75 Production for ~5,000 LBA ~3000 HBA Extrapolated SKA Upper Bound Costs 8 element cluster 6*6 m2 k€ 1.7 (2 m separation) 16 element bowtie tile 6*6 m2 k€ 3.0 32 element Vivaldi tile 6*6 m2 k€ 4.5 64 element Vivaldi tile 6*6 m2 k€ 6.0
Peak Sensitivity for 70 M€ in antenna arrays “Tiles” of 6*6 m2 with 8 or 16 dipoles and 32 or 64 Vivaldi elements Frequency and element pitch increment 21/2 Purple is receiver noise dominated Yellow is relevant EoRrange Blue is actual LOFAR range Red is relevant Pulsar range * indicates max frequency with 3 sr element beam and qmax = 47o to avoid grating lobes
Balancing Lowest against Highest octave Tiles of 6*6 m2 with 64 elements have unprecedented sensitivity in 200-480 MHz range or 2 < z < 6 Free element clusters provide best sensitivity for EoR application Combining Vivaldi tiles in centre of a station with dipole clusters in expense ratio 1:2 gives 720 m2/K at 85 & 400 MHz and 1220 m2/K at 170 MHz In “Dense” regime could tapering reduce the station side lobes In the sparse regime will grating lobes rise above the horizon when the array is pointed toward large zenith angles and pick up sky noise and disturbing sources.
Conclusions A full 1 km2 array could be realized Combine Vivaldi tiles and Dipole clusters in station Still 720 m2/K at 85 & 400 MHz Peak sensitivity of 1220 m2/K at 170 MHz at octave “centre” of band Calibratability limits practical ranges of sparse regime 1 octave in Sky noise limited regime by W ~ l2 1/2 octave In receiver noise limited regime by additional Ae ~ l2 Full instantaneous U,V-coverage for core possible Stay for EoR in “dense” regime Avoid grating lobes and blind angles Apply taper to reduce side lobes Reduces sensitivity for low frequency