
Rosana Nieto Ferreira (NSIPP/GEST/UMBC), Max Suarez (NSIPP/GSFC/NASA), Lee Byerle (University of Utah), and Jan Paegle (
Study on the influence of zonal index variability on South American climate using NCEP reanalysis data, focusing on the Southern Hemisphere zonal wind patterns and their connection to the South American Low-Level Jet (SALLJ). The research explores the impact of zonal index oscillations on the SALLJ and the circulation patterns in the region. Various simulations and analyses reveal the complex relationship between zonal index modes and atmospheric dynamics in South America.

Rosana Nieto Ferreira (NSIPP/GEST/UMBC), Max Suarez (NSIPP/GSFC/NASA), Lee Byerle (University of Utah), and Jan Paegle (
E N D
Presentation Transcript
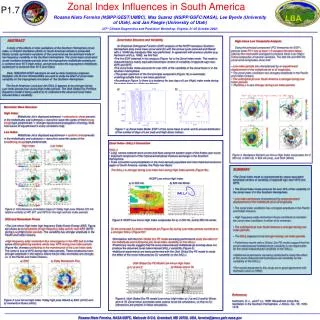
Zonal Index Influences in South America Rosana Nieto Ferreira (NSIPP/GEST/UMBC), Max Suarez (NSIPP/GSFC/NASA), Lee Byerle (University of Utah), and Jan Paegle (University of Utah) (27th Climate Diagnostics and Prediction Workshop, Virginia, 21-25 October 2002) • High minus Low Composite Analysis: • Using the principal component (PC) timeseries for EOF1, periods when PC1 was at least 1.5 standard deviation below (above) the mean were averaged to produce mean Low (High) Index composites of several variables. The 200 mb and 850 mb zonal wind composites show that: • Low index periods are characterized by an equatorward displacement of the midlatitude jet at all longitudes, • The zonal index oscillation has strongest amplitude in the Pacific and Indian Oceans. • The subtropical jet over South America is stronger during Low Index periods. • The SALLJ is also stronger during Low Index periods. High Index Low Index a) b) Figure 1: a) Zonal Index Mode: EOF1 of the zonal mean U wind, and b) annual distribution of the number of days of Low (red) and High (blue) indices. • Zonal Index – SALLJ Connection • SALLJ: • Long, narrow low-level wind current that flows along the eastern slope of the Andes year round, • Important component of the tropical-extratropical moisture exchange in the Southern Hemisphere, • Fuels convection and precipitation in the most densely populated and most important economic region of South America, namely, the Plata river Basin. Figure 2: Bandpass filtered Low minus High Index composites for U 200 mb, U 850 mb, V 850 mb (m/s), and OLR (W/m2) NCEP Low minus High Index a) U 200 mb b) 850 mb Winds SALLJ SJ Figure 5: NCEP Low minus High Index composites for a) U 200 mb, and b) 850 mb winds. Utah Global Dry PE Model Low minus High Index Do the enhanced SJ and/or midlatitude jet (Figure 5a) during Low Index periods contribute to a stronger SALLJ (Figure 5b? b) Winds at σ=0.78 a) U at σ=0.2 • Simulations with the Utah Global Dry PE model are being performed to study the effect of the midlatitude and subtropical jets zonal index variability on the SALLJ. • Preliminary results suggest that the zonal index-induced midlatitude jet anomaly does not produce the observed zonal index-induced SALLJ variability (Figure 6). • Additional experiments are being performed with the Utah Global Dry PE model to study the effect of the zonal index-induces SJ variability on the SALLJ. Figure 6: Utah Global Dry PE model Low minus High Index a) U at σ=0.2 and b) Winds at σ=0.78. Zonal mean anomalies were used to force the simulations, so that no SJ interactions are present in these simulations. a) EKE b) Eddy Momentum Flux P1.7 • Zonal Index Structure and Variability • An Empirical Orthogonal Function (EOF) analysis of the NCEP reanalysis Southern Hemisphere daily zonal mean zonal wind (U) with the annual cycle removed and filtered with a 10-360 day bandpass filter was performed. In agreement with previous studies (e.g. Hartmann and Lo, 1998), we find that: • The first EOF obtained in this analysis (Figure 1a) is the Zonal Index mode. This mode is characterized by nearly equivalent barotropic centers of variability of opposite sign near 40ºS and 60ºS. • The zonal index mode accounts for over 30% of the variability of the zonal mean U in the Southern Hemisphere. • The power spectrum of the first principal component (Figure 1b) is essentially undistinguishable from a red noise spectrum. • According to Figure 1c there is a tendency for less days of Low (High) index mode during December-February (February-March). ABSTRACT A study of the effects of slow vacillations of the Southern Hemisphere zonal index, or Antartic Oscillation (AAO) on South American climate is presented. Nearly zonally symmetric variations of the zonal wind are the dominant mode of low frequency variability in the Southern Hemisphere. The zonal mean zonal wind slowly oscillates between periods when the tropospheric midlatitude westerly jet is centered near 55˚S (high index), and periods when the tropospheric midlatitude westerly jet is centered near 40˚S (low index). Daily 1980-2000 NCEP reanalysis as well as daily Outgoing Longwave Radiation (OLR) from NOAA-CIRES are used to study the effect of zonal index variability on the tropospheric circulation of the Southern Hemisphere . The South American Low-Level Jet (SALLJ) appears to be stronger during Low Index periods than during High Index periods. The Utah Global Dry Primitive Equations model is being used to try to understand the observed zonal index-induced SALLJ variability. Baroclinic Wave Structure High Index: Midlatitude Jet is displaced poleward -> anticyclonic shear prevails in the midlatitudes and subtropics -> baroclinic wave life cycles of the thinning trough type predominate -> stronger equatorward propagation of energy. Note how waves tilt equatorward in every correlation map. Low Index: Midlatitude Jet is displaced equatorward -> cyclonic shear prevails in the midlatitudes and subtropics -> baroclinic wave life cycles of the broadening trough type predominate. • SUMMARY • The Zonal Index mode is characterized by nearly equivalent barotropic centers of variability of opposite sign near 40ºS and 60ºS. • The Zonal Index mode accounts for over 30% of the variability of the zonal mean U in the Southern Hemisphere. • Low index periods are characterized by an equatorward displacement of the midlatitude jet at all longitudes, • The zonal index oscillation has strongest amplitude in the Pacific and Indian Oceans. • High frequency eddy momentum fluxes contribute to maintain the zonal index oscillation in either of its extremes. • The subtropical jet over South America is stronger during Low Index periods. • The SALLJ appears to be stronger during Low Index periods. • Preliminary results with a Global, Dry PE model suggest that the zonal index-induced midlatitude jet variability is not responsible for the zonal index-induced variability of the SALLJ. • Additional experiments are being conducted to study the effect of the zonal index-induced Subtropical Jet variability on the variability of the SALLJ. • The results presented in this study are in good agreement with Hartmann and Lo (1998) The SALLJ is stronger during Low Index than during High Index periods (Figure 5b). MJ Figure 3: Simultaneous correlation maps of 10-day high pass filtered 200 mb relative vorticity at 45º, 50º, and 55ºS for the high and low index periods. • EKE and Momentum Fluxes • The Low minus High index high frequency Eddy Kinetic Energy (EKE; Figure 4a) shows an enhancement of high frequency eddy activity near40ºS (60ºS) during Low (High) Index periods. This variability has stronger amplitude in the Pacific and Indian Oceans. • High frequency eddy momentum flux convergence in the 40ºS belt is in the sense of strengthening westerly winds near 40ºS during Low Index periods (Figure 4b), thereby contributing to the maintenance of the Low Index state. The same is true at 60ºS during High Index periods. These tendencies have stronger amplitude in the regions where the jet index anomalies are stronger, i.e. in the Pacific and Indian Oceans. W References Hartmann, D. L., and F. Lo, 1998: Wave-driven zonal flow Vacillation in the Southern Hemisphere. J. Atmos. Sci., 55, 1303-1315. Figure 4: Low minus High Index 10-day high pass filtered a) EKE (m2/s2) and b) momentum fluxes (m2/s2). Rosana Nieto Ferreira, NASA/GSFC, Mailcode 913.0, Greenbelt, MD 20720, USA, ferreira@janus.gsfc.nasa.gov