Download
1 / 28
290 likes | 583 Views
Low Level Wind Shear at Pearson Airport. 1 Graduate Program in Earth and Space Science, York University, Toronto, Ontario 2 Environment Canada, Cloud Physics and Severe Weather Research Section, Toronto, Ontario. Yi (Emily) Zhou 1 , George Isaac 2, 1 , Peter Taylor 1. 1. Introduction.

E N D
Low Level Wind Shear at Pearson Airport 1Graduate Program in Earth and Space Science, York University, Toronto, Ontario 2Environment Canada, Cloud Physics and Severe Weather Research Section, Toronto, Ontario Yi (Emily) Zhou1, George Isaac2, 1, Peter Taylor1
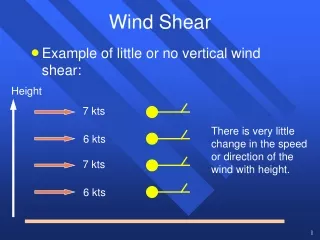
1. Introduction • Low level wind shear : change of horizontal wind direction and/or speed with height ((∂U/∂z, where U is horizontal wind) • Dangerous: increase/decrease of head wind (tail wind), hence an increase /decrease of lifting force, causing the aircraft to fly above or below its intended flight path. A survey conducted by the International Civil Aviation Organization showed that from 1964 to 1983, low level windshear caused at least 28 large transport aircraft accidents in the world that together resulted in over 500 fatalities and 200 injuries.
Tasks • Study low level wind shear from models’ out put (GEM-15 Regional, GEM-2.5 LAM and RUC-13) • Analysis of low level wind shear from AMDAR (Aircraft Meteorological Data Reports) wind profile data for Pearson Airport • Case study • Data: • From CAN-Now Archive Files: • Pearson M300 Data (2007-07-13 to 2009-03-31) • GEM-15 Regional (2007-02-27 to 2009-03-12) • GEM-2.5 LAM (2007-03-13 to 2009-03-12) • RUC-13 model data (2007-08-20 to 2009-03-11) • AMDAR data in netCDF from pftp.madis-data.noaa.gov (2007-07-13 to 2009-03-31)
2. Low level wind shear criteria • According to MANAIR 2.6.7(MANAIR - manual of standards and procedures for aviation weather forecasts), the vertical non convective low level wind shear criteria are listed as: • Wind vector change greater than 25 knots within 500 ft AGL. • Wind vector change greater than 40 knots within 1000 ft AGL. • Wind vector change greater than 50 knots within 1500 ft AGL. • A PIREP indicates a loss or gain of indicated airspeed of 20 knots or more, within 1500 ft AGL. When any of the above guidelines are met, then the low level wind shear achieves the criterion, and this wind shear is classed as a wind shear case.
3. Methods of Interpolation • Purpose of interpolation: • to obtain particular 500ft, 1000ft, and 1500ft height wind • Methods: • Cubic spline method • Linear method • Comparison 2 methods:
3. Methods of Interpolation • Comparison 2 methods: • linear is better for interpolating AMDAR data and RUC data than Cubic spline. For interpolating GEM-15 Regional and GEM-2.5 LAM, the two methods have roughly the same results. • Reason: • uneven end points distance of AMDAR and RUC . • Method Chosen: Linear
4. AMDAR wind shear analysis • Wind shear cases monthly distribution
4. AMDAR wind shear analysis • Wind shear cases time distribution Local Time?
4. AMDAR wind shear analysis • Wind shear cases distribution in different levels
5. Frequency of low level wind shear • within 500ft above ground level Wind Shear Criterion: 12.8m/s
5. Frequency of low level wind shear • Within 1000ft above ground level Wind Shear Criterion: 20.56m/s
5. Frequency of low level wind shear • Within 1500ft above ground level Wind Shear Criterion: 25.7m/s
5. Frequency of low level wind shear • Conclusion: • within 500 , 1000 feet height above ground level, the GEM-15 Regional has the best capability for low level wind shear forecasting, the second is GEM-2.5 LAM. For 1500 feet height above ground level, RUC is the best one. Low level wind shears predicted from models are lower than those observed.
6. Case study From OBS 2. From LAM
6. Case study From REG 2. From RUC
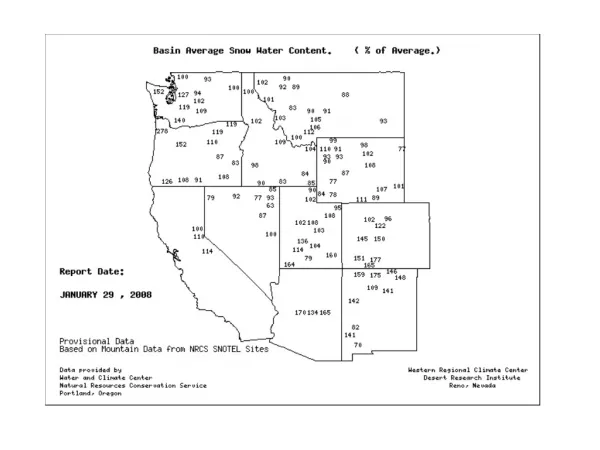
6. Case study SFC OBS From: www.climate.weatheroffice.gc.ca
6. Case study 07AM, EST, Dec 27, 2008 • Event overview From: http://www.hpc.ncep.noaa.gov/dailywxmap/index.html
6. Case study NARR DATA • Event overview Data from : http://nomads.ncdc.noaa.gov/cgi-bin/ncdc-ui/define-collection.pl?model_sys=narr&model_name=narr-a&grid_name=221
6. Case study • Event overview
6. Case study • M300 DATA • AMDAR DATA Data from: http://amdar.noaa.gov/demo_java/
6. Case study • AMDAR profile From: http://amdar.noaa.gov/demo_java/
6. Case study Conclusion • Front passage passing station • Close to surface ground, an inversion layer exists • RH>90% • Surface wind is small; above surface, wind speed increase quickly
7 Summary • Linear interpolation method is better for interpolating particular height wind. • Wind shear cases exhibit features: 1. more cases happen in autumn and winter; 2. cases occur mostly during night or morning (local time); 3. most wind shear happen within 1st 500ft AGL. • Within 500 and 1000 ft, GEM Regional has the best capability for low level wind shear forecasting, the second is LAM. For 1500 ft AGL, RUC is better. • Frontal passage passing station, strong low level T inversion support low level wind shear development.