SWT - Diagrammatics
360 likes | 534 Views
SWT - Diagrammatics. Lecture 1/4 - Introduction to Diagrams 25-April-2000. Introduction. My name is Athanasios Tsintsifas, for short just Thanassis... I am a Ph.D. student and a member of the LTR department of the University of Nottingham.

SWT - Diagrammatics
E N D
Presentation Transcript
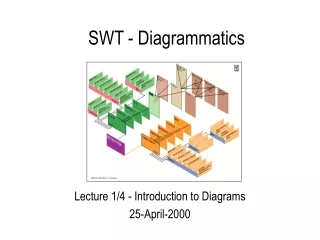
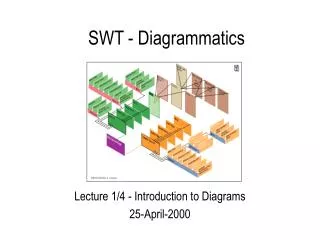
SWT - Diagrammatics Lecture 1/4 - Introduction to Diagrams 25-April-2000
Introduction • My name is Athanasios Tsintsifas, for short just Thanassis... • I am a Ph.D. student and a member of the LTR department of the University of Nottingham. • I have contributed in the development of CourseMaster and created the Daidalos system as part of my research. • You can reach me at: azt@cs.nott.ac.uk • I have a page at : http://www.cs.nott.ac.uk/~azt • You‘ll be able to find each lecture’s notes in : • www.cs.nott.ac.uk/~azt/diagrammatics/index.html
LTR • Learning Technology Research (LTR) • The LTR group is focusing its research in finding ways to facilitate teaching and enhance the learning experience. • For the last three years, LTR has been developing the CourseMaster system. • The Ceilidh system, the ancestor of CourseMaster, has been in use for over 10 years by more than 100 universities in the world. WWW Interface, Prolog Diagrammatical Assessment Pascal SQL Course Master CD-ROM First version, C module Ceilidh 2, C, C++ modules SML X-Interface, Software-Tools Java Z 1988 1990 1992 1995 1998 1999 2000
Automatic Assessment Categories • Two types of assessment : • Fixed response : • Multiple Choices, • Questionnaires • Free response : • Programming languages, • Essays, • Graphics, • Diagramming • The Ceilidh system has been assessing both fixed and free response coursework. • With CourseMaster and Daidalos graphical and diagramming exercises can be assessed too!
Problems that needed overcoming • Graphics and Diagramming based exercise poses inherent problems to a system for automatic assessment : • Each domain needs its own : • graphical editor, • assessement metrics • Domain editors are complex to create. • Generic editors are unable to retain extra information that is needed for diagrammatic assessment of coursework. • The setting of an automatically assessed graphical exercise is a complex process that requires the cooperation of many users.
The Approach Daidalos Ariadne Theseus CM Clients CM servers DATSYS system CourseMaster system Java platform Operating Systems: Windows 95, 98, NT, 2000, Solaris, Linux
The Approach • DATsys is a Object Oriented Framework encapsulating the design of a family of diagramming editors. • Daidalos, Ariadne and Theseus are composed with parts of the same framework. : • Daidalos provides facilities to design graphically domain component libraries. • Ariadne provides facilities to automatically generate the student diagrammatic editor (Theseus) using Daidalos’s libraries and the required marking specification. • Theseus is used by the students in order to design their diagrams and can be generated independently for each exercise, unit or course.
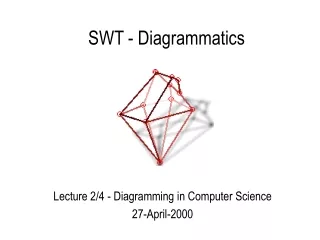
What we will be covering : • There will be three more lectures on diagramming and three exercises in total: • (D1) Introduction to Diagrams, • (D2) Diagrams in Sciences and CS - Logic Diagrams, • (E1) Two logic circuit exercises • (D3) Diagrams for Software Development • (D4) OO Diagramming / UML / Meta-diagramming • (E2) One OO design exercise (D1) (D2) (E1) (D3) (D4) (E2) Tuesday 25/04 Thursday 27/04 Friday 28/04 Tuesday 02/05 Thursday 04/05 Friday 05/05
What we will be covering : • First lecture : • Introduction - definitions • A historical review • Diagram advantages • Diagram universal properties • Diagram origins • Important diagrammatic domains
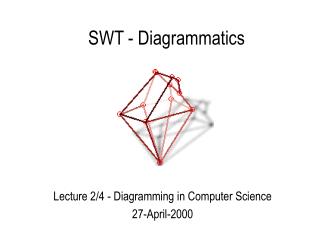
What we will be covering : • Second lecture : • Diagram Distinctions, • Flowcharts, Nassi-Shneiderman Diagrams, • Structure Diagrams, Dataflow Diagrams • Software Level Charts, Cell-Arrow Diagrams • State Transmission Diagrams, Petri Nets, • Logic Gates, Logic Circuits, Venn Diagrams • Entity-Relationship Diagrams
What we will be covering : • Exercise week 1: • Exercise Lift: This is a simple exercise, in which you'll have to design the logic circuit which will operate a lift using logic gates. • Exercise Nuclear:This is a more advanced exercise, in which you'll have to design the logic circuit which controls the launch of nuclear weapons (albeit a simplified one!)
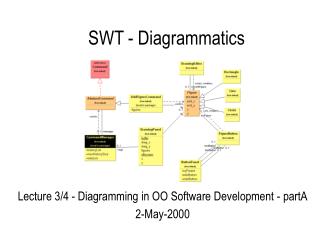
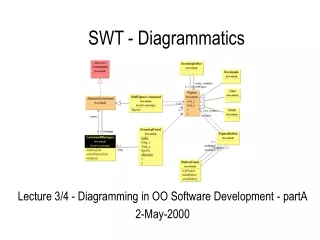
What we will be covering : • Third lecture : • OO Design Notations, Objects, • Messages / Control & Data Flow, Classes • Class Attributes and Operations • Visibility of Attributes and Operations • Relationships: Association, Multiplicity • Relationships: Aggregation • Relationships: Dependency • Relationships: Inheritance
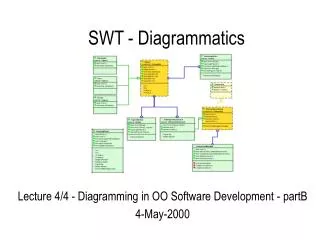
What we will be covering : • Fourth lecture : • UML diagramming • Object diagrams with UML • Class diagrams with UML • OO Developments • Meta-Diagramming • Software Demonstrations • How to Proceed / Further Information
What we will be covering : • Exercise week 2 • Exercise hotel: This is a simple exercise, in which you'll have to design (not implement) a class diagram for a hotel room booking system. You will be using a similar to UML notation.
Dia-gramm(a),(h),(wn)to - line Representation More Arbitrary More Homomorphic to convey a message by means of drawing lines. TEXT PICTURES DIAGRAMS
Diagram • James Maxwell's definition (Encyclopedia Brittanica, 11th edition): a figure drawn in such a manner that the geometrical relations between the parts of the figure illustrate relations between other objects.
Diagrams are : • In general, representations of things, thoughts and relationships that usually : • attempt to present information in a concise, clear and understandable way, • try to convey information using a specific notation or not, • can present non-visual information in a visual form, • can depend on agreed conventions, like written text, but their overall form affects their interpretation.
History of Diagrams • The earliest abstract illustrations are maps. • Maps relate physical distances between locations in the world and physical distances of these locations on paper. • By their nature, they abstract out detail (e.g. roads are represented by straight lines, coastlines are abbreviated etc) • The map is not the territory...?
The History of Diagrams • Geometric diagrams have been around for quite some time : Manuscripts containing proofs with diagrams of the Pythagorean theorem exist from the time of ancient Greeks -These diagrams are also based on a concept of metric space. • Descartes' invented the Cartesian coordinate system in the 17th century. • Scientific discoveries in physics and chemistry resulted in increasingly abstract diagrams. C8H10N4O2
The History of Diagrams • Topological diagrams: their history is difficult to trace. • In the middle ages, hierarchies of trees were used to document lineage. • Religion and cosmology of the middle ages made great use of diagrams, including graphs. • In the Renaissance, the rediscovery of Greek thought resulted in many diagrams of philosophical and scientific nature - mostly for illustration purposes .
The History of Diagrams • In the 19th century, the work of Boole inspired the invention of Venn diagrams. • Charles Peirce extended these and invented existential graphs : • The explosion of abstract mathematics resulted in the proliferation of tree and graph representations. B A
For some tasks diagramming works better x SP(I,O)xy : delay(I, y)not(I, x)and(y, x, O)delay(I, O) t : O(t+1) = I(t) not(I,O)t : O(t) = 1 - I(t) and(I1, I2, O)t : O(t) = I1(t) x I2 (t) Two representations that describe a configuration of the same single pulser. o y i
Advantages of diagramming • Many comparisons of verbal and visual tasks have shown that human capabilities differ in the way they are distributed through the brain: different people choose different strategies to accomplish the same tasks. • Although there appear to be differences between the strategies that individuals choose in visual reasoning tasks, strategy is also affected by education, expertise and culture. • Furthermore, topological complexity of a diagram affects the performance of an individual.
Advantages of diagramming • Advocates of diagrams have suggested that the right hemisphere of the brain is "needlessly at rest and underutilised" when using text-only notation for descriptions. • Research has also shown that some simple visual tasks can require more time when carried out by the left hemisphere. • There are many tasks in which verbal and visual information is combined. Research has shown that memory improves when a concrete image can be associated with a task (e.g. for navigation purposes: route memory depends on visual landmarks)
Universal Properties • However, even if many diagrams rely on expert knowledge, diagrams have many universal properties: • Adults from all cultures show quantity increasing from bottom to top of a page. • Time direction is always from left to right. • Everybody can be aware that an object is related to another object just by observing at the connectivity between the two; it doesn’t matter what kind of connection it is as long as the connection is described as a kind of a line. • Any more universal properties?
Diagrams are based on origins of : • Resemblance: The most naive account (more likely to be made of diagrams with a strongly pictorial element) is simply that they resemble the things they refer to. • Metaphor: It is possible to depict things that do not exist physically, that we, humans, have a mental image of them (e.g. abstract concepts, or structure representations in computer systems) • Concrete Descriptions: By abstracting physical entities we can get a better picture of the world around us.
Diagrams offer : • Locality and Labels: Diagrams group related information in the same area, so searches can be constrained to the scope of a goal. Correspondences can also be established from topological relationships. • Expressive Power and Specificity: Diagrams allow multiple layer abstraction. They have fewer interpretations than unconstrained textual notations. • Pragmatics: Diagrams provide a “vocabulary” for discussing the way that notations are interpreted. Every notation highlights some kind of information and obscures other aspects in which we are not interested in at that moment.
Diagram use : • Applied psychology uses diagrams as a way to learn about the nature of cognition, and analyses how different diagram types and diagram features affect human problem solving. • Cognitive science: the use of computer models allows researchers to propose and investigate systematic (and potentially formalisable) models of reasoning. Cognitive science is focused on definite descriptions of diagrammatic reasoning tasks and investigates how can these models accommodate analogue representations rather than symbolic logic ones.
Diagram use : • Linguistics is also using in diagrams in their quest to analyse syntax, semantics, and pragmatics of spoken languages. • Computational linguistics is using diagrams to depict information that enables research analogous to the research on verbal language e.g. formulation of grammars that allow automatic parsing and generation of diagrams. • Visual programming promises to make programming accessible to more people via the use of diagrams.
Diagram use : • Data visualisation: as most diagrams are created by a person with a com- municative intent and an understanding of the expected reader, data visualisation diagrams help with the characterisation of data and formalisation of design rules in order to facilitate the user (e.g. in helping a programmer to write code). • Graphic design uses diagrams in order to facilitate the task of a graphic designer to accept a given set of information, who can then prepare a way of communicating that information effectively.
Diagram use : • Education uses diagrams in order to facilitate education and teaching in all subjects. Education is concerned with finding out which types of diagrams are appropriate for what teaching goals. Learning concepts diagrammatically can help to solidify abstract concepts. • History and philosophy of science: Scientific discovery has often been associated with novel uses of representations (such as algebra or Cartesian coordinates). Past discoveries have largely been founded on diagrams.
Diagram use : • Architecture: Architects spend much of their time working with visual representations, although their most common representation is the sketch. Diagrams support architectural problem solving and facilitate the creativity that architects experience when sketching • Management - Brainstorming: Mind mapping techniques use diagrams in order to categorise tasks, to help people remember better and to provide a visual path to the tasks that need to be performed.
Diagram use : • computer science and engineering: diagramsare used to great extent in order to facilitate information sharing, information filtering and understanding of complex notions. • Biology & Genetics Cytochrome P450 Oxidoreductase Ribbon structure of MCAD monomer with C8-CoA complex