Measures of Central Tendency
570 likes | 1.25k Views
Measures of Central Tendency. FLORINDA M SOLIMAN TEACHER II. TAGAYTAY CITY SCIENCE NATIONAL HIGH SCHOOL. Measures of Central Tendency. A measures of central tendency may be defined as single expression of the net result of a complex group.

Measures of Central Tendency
E N D
Presentation Transcript
Measures of Central Tendency FLORINDA M SOLIMAN TEACHER II TAGAYTAY CITY SCIENCE NATIONAL HIGH SCHOOL
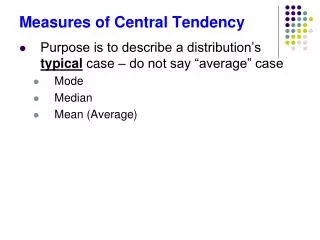
Measures of Central Tendency • A measures of central tendency may be defined as single expression of the net result of a complex group. • There are two main objectives for the study of measures of Central Tendency. • To get one single value that represents the entire data. • To facilitate comparison
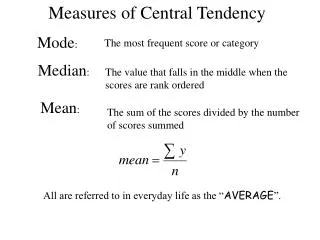
Measures of Central Tendency • There are three averages or measures of central tendency • Mean • Mode • Median
Measures of Central Tendency • Mean/Arithmetic Mean The most commonly used and familiar index of central tendency for a set of raw data or a distribution is the mean • The mean is simple Arithmetic Average • The arithmetic mean of a set of values is their sum divided by their number
Measures of Central Tendency • MERITS OF THE USE OF MEAN It is easy to understand It is easy to calculate It utilizes entire data in the group It provides a good comparison It is rigidly defined
Measures of Central Tendency • Limitations • In the absence of actual data it can mislead • Abnormal difference between the highest and the lowest score would lead to fallacious conclusions • A mean sometimes gives such results as appear almost absurd. e.g. 4.3. children • Its value cannot be determined graphically
Measures of Central Tendency Steps in Constructing Frequency Distribution Table • 1. Range = Highest Score – Lowest Score • 2. Class Width =
Chona S. CupinoTEACHER II Calculation for Mean Amadeo National High School
Calculation of Arithmetic Mean For Group Data Assume mean Method: Mean = AM +
Measures of Central Tendency Calculation of Arithmetic Mean For Group Data • X = midpoint • AM = Assumed Mean • i = Class Interval size • fd = Product of the frequency and the corresponding deviation
Measures of Central Tendency Mean = AM + (-24) 80 = 29.5 + 4 = 28.3
Jocelyn C. EspineliTeacher III Calculation for Median Amadeo National High School
Measures of Central Tendency • Median • When all the observation of a variable are arranged in either ascending or descending order the middles observation is Median. • It divides the whole data into equal proportion. In other words 50% observations will be smaller than the median and 50% will be larger than it.
Measures of Central Tendency Merits of Median • Like mean, Median is simple to understand • Median is not affective by extreme items • Median never gives absurd or fallacious result • Median is specially useful in qualitative phenomena
Median = L + • Where, L = exact lower limit of the Cl in which Median lies F = Cumulative frequency up to the lower limit of the Cl containing Median fm = Frequency of the Cl containing median i = Size of the class intervals
Measures of Central Tendency Median = L + Here; L = 27.5 F = 35 fm =10 (40 – 35) 10 = 27.5 + 4 = 27.5 + 2 = 29.5
VariabilityStandard Deviation MARILOU M. MARTIN TEACHER - 1 IMUS NATIONAL HIGH SCHOOL
Variability • The goal for variability is to obtain a measure of how spread out the scores are in a distribution. • A measure of variability usually accompanies a measure of central tendency as basic descriptive statistics for a set of scores.
Central Tendency and Variability • Central tendency describes the central point of the distribution, and variability describes how the scores are scattered around that central point. • Together, central tendency and variability are the two primary values that are used to describe a distribution of scores.
Variability • Variability serves both as a descriptive measure and as an important component of most inferential statistics. • As a descriptive statistic, variability measures the degree to which the scores are spread out or clustered together in a distribution. • In the context of inferential statistics, variability provides a measure of how accurately any individual score or sample represents the entire population.
Variability • When the population variability is small, all of the scores are clustered close together and any individual score or sample will necessarily provide a good representation of the entire set. • On the other hand, when variability is large and scores are widely spread, it is easy for one or two extreme scores to give a distorted picture of the general population.
Measuring Variability • Variability can be measured with • the range • the interquartile range • the standard deviation/variance. • In each case, variability is determined by measuring distance.
The Standard Deviation • Standard deviation measures the standard distance between a score and the mean. • The calculation of standard deviation can be summarized as a four-step process:
The Standard Deviation Table • Compute the deviation (distance from the mean) for each score. • Solve for the product of frequency and deviation and solve for the total frequency deviation.
The Standard Deviation • Compute for the sum of the product of frequency deviation square.(fd’²)
The Standard Deviation Formula SD = SD = SD = 4 ( 2.879) = 11.52
Means Percentage Score SHIRLEY PEL – PASCUAL Master Teacher – I GOV. FERRER MEMORIAL NATIONAL HIGH SCHOOL
How to Convert a Mean Score to a Percentage • Mean scores are used to determine the average performances of students or athletes, and in various other applications. Mean scores can be converted to percentages that indicate the average percentage of the score relative to the total score.
How to Convert a Mean Score to a Percentage Mean scores can also be converted to percentages to show the performance of a score relative to a specific score. For instance, a mean score can be compared to the highest score with a percentage for a better comparison. Percentages can be useful means of statistical analysis.
How to Convert a Mean Score to a Percentage • Instructions • Find the mean score if not already determined. The mean score can be determined by adding up all the scores and dividing it by "n," the number of scores.
How to Convert a Mean Score to a Percentage • Instructions 2 Determine the score that you want to compare the mean score to. You may compare the mean score with the highest possible score, the highest score, or a specific score.
How to Convert a Mean Score to a Percentage • Instructions 3. Divide the mean score by the score you decided to use in step 2.
How to Convert a Mean Score to a Percentage • Instructions 4. Multiply the decimal you obtain in step 3 by 100, and add a % sign to obtain the percentage. You may choose to round the percentage to the nearest whole number.