Download
1 / 36
360 likes | 380 Views
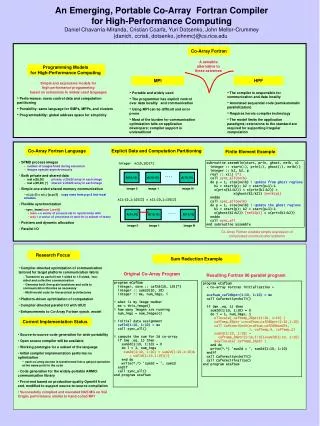
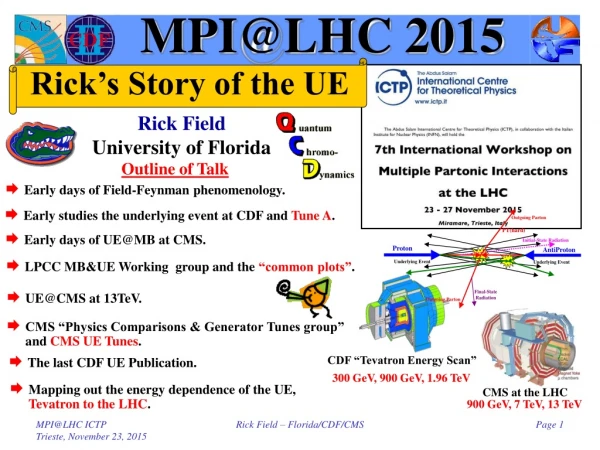
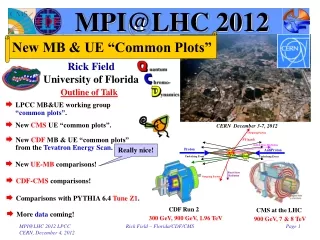
MPI@LHC 2012. New MB & UE “Common Plots”. Rick Field University of Florida. Outline of Talk. LPCC MB&UE working group “common plots”. New CMS UE “common plots”. CERN December 3-7, 2012. New CDF MB & UE “common plots” from the Tevatron Energy Scan. Really nice!.

E N D
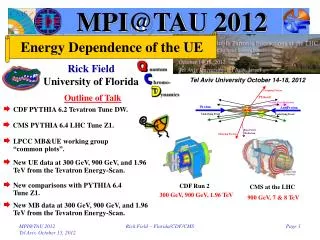
MPI@LHC 2012 New MB & UE “Common Plots” Rick Field University of Florida Outline of Talk • LPCC MB&UE working group “common plots”. • New CMS UE “common plots”. CERN December 3-7, 2012 • New CDF MB & UE “common plots” from the Tevatron Energy Scan. Really nice! • New UE-MB comparisons! • CDF-CMS comparisons! • Comparisons with PYTHIA 6.4 Tune Z1. CDF Run 2 CMS at the LHC • More data coming! 300 GeV, 900 GeV, 1.96 TeV 900 GeV, 7 & 8 TeV Rick Field – Florida/CDF/CMS
MB&UE Working Group MB & UE Common Plots CMS ATLAS • The LPCC MB&UE Working Group has suggested several MB&UE “Common Plots” the all the LHC groups can produce and compare with each other. Rick Field – Florida/CDF/CMS
CMS Common Plots Note that all the “common plots” require at least one charged particle with pT > 0.5 GeV/c and |h| < 0.8! This done so that the plots are less sensitive to SD and DD. Direct charged particles (including leptons) corrected to the particle level with no corrections for SD or DD. Rick Field – Florida/CDF/CMS
MB Common Plots 7 TeV Direct charged particles (including leptons) corrected to the particle level with no corrections for SD or DD. Rick Field – Florida/CDF/CMS
UE Common Plots Rick Field – Florida/CDF/CMS
Tevatron Energy Scan • Just before the shutdown of the Tevatron CDF has collected more than 10M “min-bias” events at several center-of-mass energies! 900 GeV 300 GeV 1.96 TeV 300 GeV 12.1M MB Events 900 GeV 54.3M MB Events Rick Field – Florida/CDF/CMS
CDF Common Plots Direct charged particles (including leptons) corrected to the particle level with no corrections for SD or DD. Rick Field – Florida/CDF/CMS
UE Observables • “Transverse” Charged Particle Density: Number of charged particles (pT > 0.5 GeV/c, |h| < hcut) in the “transverse” region as defined by the leading charged particle, PTmax, divided by the area in h-f space, 2hcut×2p/3, averaged over all events with at least one particle with pT > 0.5 GeV/c, |h| < hcut. • “Transverse” Charged PTsum Density: Scalar pT sum of the charged particles (pT > 0.5 GeV/c, |h| < hcut) in the “transverse” region as defined by the leading charged particle, PTmax, divided by the area in h-f space, 2hcut×2p/3, averaged over all events with at least one particle with pT > 0.5 GeV/c, |h| < hcut. • “Transverse” Charged Particle Average PT: Event-by-event <pT> = PTsum/Nchg for charged particles (pT > 0.5 GeV/c, |h| < hcut) in the “transverse” region as defined by the leading charged particle, PTmax, averaged over all events with at least one particle in the “transverse” region with pT > 0.5 GeV/c, |h| < hcut. • Zero “Transverse” Charged Particles: If there are no charged particles in the “transverse” region then Nchg and PTsum are zero and one includes these zeros in the average over all events with at least one particle with pT > 0.5 GeV/c, |h| < hcut. However, if there are no charged particles in the “transverse” region then the event is not used in constructing the “transverse” average pT. hcut = 1.0 and hcut = 0.8 Rick Field – Florida/CDF/CMS
New CDF UE Data 1.96 TeV 25,371,145 Events 900 GeV 37,075,521 Events • New Corrected CDF data at 300 GeV, 900 GeV, and 1.96 TeV on the “transverse” charged particle density, dN/dhdf, as defined by the leading charged particle (PTmax) for charged particles with pT > 0.5 GeV/c and |h| < 1.0. 300 GeV 7,233,840 Events Rick Field – Florida/CDF/CMS
New CDF UE Data • New Corrected CDF data at 300 GeV, 900 GeV, and 1.96 TeV on the “transverse” charged PTsum density, dPT/dhdf, as defined by the leading charged particle (PTmax) for charged particles with pT > 0.5 GeV/c and |h| < 1.0. Rick Field – Florida/CDF/CMS
New CDF UE Data • New Corrected CDF data at 300 GeV, 900 GeV, and 1.96 TeV on the “transverse” charged particle average pT, as defined by the leading charged particle (PTmax) for charged particles with pT > 0.5 GeV/c and |h| < 1.0. Rick Field – Florida/CDF/CMS
Energy Dependence • New Corrected CDF data at 300 GeV, 900 GeV, and 1.96 TeV on the “transverse” charged particle density, dN/dhdf, as defined by the leading charged particle (PTmax) for charged particles with pT > 0.5 GeV/c and |h| < 1.0 for 5.0 < PTmax < 6.0 GeV/c. • New Corrected CDF data at 300 GeV, 900 GeV, and 1.96 TeV on the “transverse” charged particle density, dN/dhdf, as defined by the leading charged particle (PTmax) for charged particles with pT > 0.5 GeV/c and |h| < 1.0. Rick Field – Florida/CDF/CMS
Energy Dependence • New Corrected CDF data at 300 GeV, 900 GeV, and 1.96 TeV on the “transverse” charged PTsum density, dPT/dhdf, as defined by the leading charged particle (PTmax) for charged particles with pT > 0.5 GeV/c and |h| < 1.0. • New Corrected CDF data at 300 GeV, 900 GeV, and 1.96 TeV on the “transverse” charged PTsum density, dPT/dhdf, as defined by the leading charged particle (PTmax) for charged particles with pT > 0.5 GeV/c and |h| < 1.0 for 5.0 < PTmax < 6.0 GeV/c. Rick Field – Florida/CDF/CMS
Energy Dependence • New Corrected CDF data at 300 GeV, 900 GeV, and 1.96 TeV on the “transverse” charged particle average pT as defined by the leading charged particle (PTmax) for charged particles with pT > 0.5 GeV/c and |h| < 1.0 for 5.0 < PTmax < 6.0 GeV/c. • New Corrected CDF data at 300 GeV, 900 GeV, and 1.96 TeV on the “transverse” charged particle average pT as defined by the leading charged particle (PTmax) for charged particles with pT > 0.5 GeV/c and |h| < 1.0. Rick Field – Florida/CDF/CMS
Energy Ratio: 1960/300 • Ratio of the CDF data at 300 GeV and 1.96 TeV on the “transverse” charged particle density, dN/dhdf, as defined by the leading charged particle (PTmax) for charged particles with pT > 0.5 GeV/c and |h| < 1.0. Shows 1.96 TeV divided by 300 GeV. • New Corrected CDF data at 300 GeV, 900 GeV, and 1.96 TeV on the “transverse” charged particle density, dN/dhdf, as defined by the leading charged particle (PTmax) for charged particles with pT > 0.5 GeV/c and |h| < 1.0. Rick Field – Florida/CDF/CMS
Energy Ratio: 900/300 • New Corrected CDF data at 300 GeV, 900 GeV, and 1.96 TeV on the “transverse” charged particle density, dN/dhdf, as defined by the leading charged particle (PTmax) for charged particles with pT > 0.5 GeV/c and |h| < 1.0. • Ratio of the CDF data at 300 GeV and 900 GeV on the “transverse” charged particle density, dN/dhdf, as defined by the leading charged particle (PTmax) for charged particles with pT > 0.5 GeV/c and |h| < 1.0. Shows 900 GeV divided by 300 GeV. Rick Field – Florida/CDF/CMS
Energy Ratio: 1960/900 • New Corrected CDF data at 300 GeV, 900 GeV, and 1.96 TeV on the “transverse” charged particle density, dN/dhdf, as defined by the leading charged particle (PTmax) for charged particles with pT > 0.5 GeV/c and |h| < 1.0. • Ratio of the CDF data at 900 GeV and 1.96 TeV on the “transverse” charged particle density, dN/dhdf, as defined by the leading charged particle (PTmax) for charged particles with pT > 0.5 GeV/c and |h| < 1.0. Shows 1.96 TeV divided by 900 GeV. Rick Field – Florida/CDF/CMS
PYTHIA 6.4 Tune Z1 ATLAS CMS CDF CDF ALICE CDF Rick Field – Florida/CDF/CMS
PYTHIA 6.4 Tune Z1 CMS ATLAS CDF CDF ALICE CDF Rick Field – Florida/CDF/CMS
PYTHIA 6.4 Tune Z1 Rick Field – Florida/CDF/CMS
|h| < 0.8 versus |h| < 1.0 • Corrected CDF data at 1.96 TeV on the average charged particle density, dN/dhdf, in the “transverse” region as defined by the leading charged particle (PTmax) for charged particles with pT > 0.5 GeV/c and |h| < 0.8 and |h| < 1.0. The data are corrected to the particle level with errors that include both the statistical error and the systematic uncertainty. • Corrected CDF data at 1.96 TeV on the average number of charged particle in the “transverse” region as defined by the leading charged particle (PTmax) for charged particles with pT > 0.5 GeV/c and |h| < 0.8 and |h| < 1.0. The data are corrected to the particle level with errors that include both the statistical error and the systematic uncertainty. Rick Field – Florida/CDF/CMS
|h| < 0.8 versus |h| < 1.0 • Corrected CDF data at 1.96 TeV on the charged particle density, the charged PTsum density, and the average pT in the “transverse” region as defined by the leading charged particle (PTmax) for charged particles with pT > 0.5 GeV/c and |h| < 0.8 and |h| < 1.0. The data are corrected to the particle level with errors that include both the statistical error and the systematic uncertainty. Rick Field – Florida/CDF/CMS
|h| < 0.8 versus |h| < 1.0 • Corrected CDF data at 900 GeV on the charged particle density, the charged PTsum density, and the average pT in the “transverse” region as defined by the leading charged particle (PTmax) for charged particles with pT > 0.5 GeV/c and |h| < 0.8 and |h| < 1.0. The data are corrected to the particle level with errors that include both the statistical error and the systematic uncertainty. Rick Field – Florida/CDF/CMS
|h| < 0.8 versus |h| < 1.0 • Corrected CDF data at 300 GeV on the charged particle density, the charged PTsum density, and the average pT in the “transverse” region as defined by the leading charged particle (PTmax) for charged particles with pT > 0.5 GeV/c and |h| < 0.8 and |h| < 1.0. The data are corrected to the particle level with errors that include both the statistical error and the systematic uncertainty. Rick Field – Florida/CDF/CMS
New CDF MB Data CMS CDF CDF CDF • New Corrected CDF data at 300 GeV, 900 GeV, and 1.96 TeV on on pseudo-rapidity distribution of charged particles, dN/dh, with pT > 0.5 GeV/c. Events are required to have at least one charged particle with |h| < 0.8 and pT > 0.5 GeV/c. The data are corrected to the particle level with errors that include both the statistical error and the systematic uncertainty. Rick Field – Florida/CDF/CMS
New CDF MB Data CMS CDF CDF CDF • New Corrected CDF data at 300 GeV, 900 GeV, and 1.96 TeV on on pseudo-rapidity distribution of charged particles, dN/dh, with pT > 1.0 GeV/c. Events are required to have at least one charged particle with |h| < 0.8 and pT > 1.0 GeV/c. The data are corrected to the particle level with errors that include both the statistical error and the systematic uncertainty. Rick Field – Florida/CDF/CMS
Energy Dependence dN/dh • CMS data at 7 TeV and 900 GeV and CDF data at 1.96 TeV, 900 GeV, and 300 GeV on dN/dh at h = 0 with pT > 0.5 GeV/c as a function of the center-of-mass energy. Events are required to have at least one charged particle with |h| < 0.8 and pT > 0.5 GeV/c. The data are corrected to the particle level with errors that include both the statistical error and the systematic uncertainty. Rick Field – Florida/CDF/CMS
Energy Dependence dN/dh • CMS data at 7 TeV and 900 GeV and CDF data at 1.96 TeV, 900 GeV, and 300 GeV on dN/dh at h = 0 with pT > 1.0 GeV/c as a function of the center-of-mass energy. Events are required to have at least one charged particle with |h| < 0.8 and pT > 1.0 GeV/c. The data are corrected to the particle level with errors that include both the statistical error and the systematic uncertainty. Rick Field – Florida/CDF/CMS
Overall Charged Particle Density • Corrected CDF data on the pseudo-rapidity distribution, dN/dh, for charged with pT > 0.5 GeV/c and |h| < 0.8 for events with at least one charged particle with pT > 0.5 GeV/c and |h| < 0.8. • Corrected CDF and CMS data overall density of charged particles with pT > 0.5 GeV/c and |h| < 0.8 for events with at least one charged particle with pT > 0.5 GeV/c and |h| < 0.8 plotted versus the center-of-mass energy (log scale). The data are corrected to the particle level with errors that include both the statistical error and the systematic uncertainty. Rick Field – Florida/CDF/CMS
MB versus the UE • Corrected CDF data on the charged particle density, in the “transverse” region as defined by the leading charged particle (PTmax) for charged particles with pT > 0.5 GeV/c and |h| < 0.8. The data are corrected to the particle level with errors that include both the statistical error and the systematic uncertainty and are compared with the overall charged particle density (straight lines). Rick Field – Florida/CDF/CMS
MB versus the UE • Corrected CDF and CMS data on the overall density of charged particles with pT > 0.5 GeV/c and |h| < 0.8 for events with at least one charged particle with pT > 0.5 GeV/c and |h| < 0.8 and on the charged particle density, in the “transverse” region as defined by the leading charged particle (PTmax) for charged particles with pT > 0.5 GeV/c and |h| < 0.8 with 5 < PTmax < 6 GeV/c. The data are plotted versus the center-of-mass energy (log scale). Amazing! Rick Field – Florida/CDF/CMS
“Transverse”/Overall Amazing! • Corrected CDF and CMS data on the charged particle density ratio, in the “transverse” region as defined by the leading charged particle (PTmax) for charged particles with pT > 0.5 GeV/c and |h| < 0.8 for 5 < PTmax < 6 GeV/c. The ratio corresponds to the “transverse” charged particle density divided by the overall charged particle density. The data are plotted versus the center-of-mass energy (log scale). • Corrected CDF and CMS data on the charged particle density ratio, in the “transverse” region as defined by the leading charged particle (PTmax) for charged particles with pT > 0.5 GeV/c and |h| < 0.8. The ratio corresponds to the “transverse” charged particle density divided by the overall charged particle density. Rick Field – Florida/CDF/CMS
MB Common Plots 900 GeV Direct charged particles (including leptons) corrected to the particle level with no corrections for SD or DD. Rick Field – Florida/CDF/CMS
CDF versus CMS CDF slightly higher than CMS! • CDF and CMS data at 900 GeV on the pseudo-rapidity distribution, dN/dh, for charged with pT > 0.5 GeV/c and |h| < 0.8 for events with at least one charged particle with pT > 0.5 GeV/c and |h| < 0.8. The data are corrected to the particle level with errors that include both the statistical error and the systematic uncertainty. CDF slightly higher than CMS! CDF slightly higher than LHC! • CDF and CMS data at 900 GeV/c on the charged particle density in the “transverse” region as defined by the leading charged particle (PTmax) for charged particles with pT > 0.5 GeV/c and |h| < 0.8. The data are corrected to the particle level with errors that include both the statistical error and the systematic uncertainty. Rick Field – Florida/CDF/CMS
CDF versus CMS “Transverse”: CDF > CMS by 10% not quite equal within sys-errors! • CDF data divided by the CMS data at 900 GeV for the charged particle density in the “transverse” region as defined by the leading charged particle (PTmax) for charged particles with pT > 0.5 GeV/c and |h| < 0.8 and for the overall density of charged particles with pT > 0.5 GeV/c and |h| < 0.8 for events with at least one charged particle with pT > 0.5 GeV/c and |h| < 0.8 (straight line). Overall: CDF > CMS by 4% equal within sys-errors! • QCD 2-2 sub-processes contributing to proton-proton and proton-antiproton collisions at 900 GeV from PYTHIA Tune Z1. Different sub-processes in proton-antiproton and proton-proton collisions! “Transverse” Plateau: CDF > CMS by 4% equal within sys-errors! Rick Field – Florida/CDF/CMS
More Data Coming! What we are learning should allow for a deeper understanding of MPI which will result in more precise predictions at the future LHC energy of 13 TeV! Less than 4% change! • CDF - More UE Observables: Nchg density, PTsum density, average pT, “toward”, “away”, “transverse”, “transMAX”, “transMIN”, distributions, etc.. • CDF - Two h Ranges: Will do (pT > 0.5 GeV/c, |h| < 0.8) as well as (pT > 0.5 GeV, |h| < 1). • CDF - Min-Bias: Many MB observables: Multiplicity, dN/dh, pT distribution, <pT> versus Nchg, etc. Soon we will have MB & UE data at 300 GeV, 900 GeV, 1.96 TeV, 7 TeV, and 8 TeV! We can study the energy dependence more precisely than ever before! Rick Field – Florida/CDF/CMS