Download
1 / 60
600 likes | 704 Views
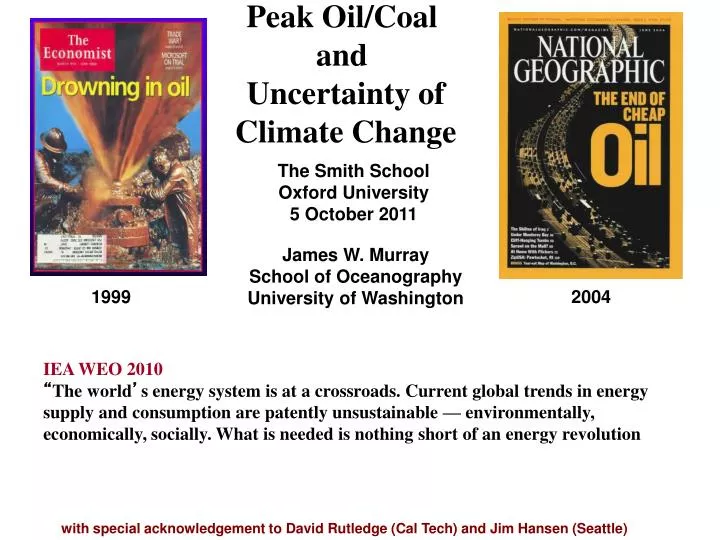
Peak Oil/Coal and Uncertainty of Climate Change. The Smith School Oxford University 5 October 2011. James W. Murray School of Oceanography University of Washington. 1999. 2004. IEA WEO 2010

E N D
Peak Oil/Coal and Uncertainty of Climate Change The Smith School Oxford University 5 October 2011 James W. Murray School of Oceanography University of Washington 1999 2004 IEA WEO 2010 “The world’s energy system is at a crossroads. Current global trends in energy supply and consumption are patently unsustainable — environmentally, economically, socially. What is needed is nothing short of an energy revolution with special acknowledgement to David Rutledge (Cal Tech) and Jim Hansen (Seattle)
CO2 emission Scenarios From ∑ Oil + Gas + Coal These scenarios drive almost all climate change research
Today’s Conclusions Evidence is increasingly strong suggesting that energy resource limitation will be a serious issue. Peak Oil has occurred or will occur soon. Why? existing oil fields are declining at ~5-7% per year (~5 mbd) New discoveries are not keeping up. Even so production rate, not reserves, are what matter for our economy Oil and Coal Reserves are much less than assumed by the IPCC. Increased supply from other sources is neither scalable or timely. We know enough to see that Resource Limitation needs to at least be an IPCC Scenario “uncertainty about climate change must include uncertainty about the source of CO2“
Some Definitions IEA – International Energy Agency (International, Paris) EIA – Energy Information Agency in US Department of Energy (US DOE) CERA – Cambridge Energy Research Association (Dir: Daniel Yergin) IPCC – Intergovernmental Panel on Climate Change SRES – Special Report on Emission Scenerios OPEC – Oil Producing and Exporting Countries Non-OPEC USGS – US Geological Survey MMS – US Mineral Management Service WEC – World Energy Council EWG – Energy Watch Group ANWAR – Alaska National Wildlife ASPO – Association for the Study of Peak Oil Useful websites: www.theoildrum.com www.aspo-us.com www.energybulletin.net www.peakoil.net Definitions of Oil IEA reports Crude + condensate + natural gas liquids = 82 mbd EIA reports Crude + condensates = 74 mbd NGL = propane, butane Condensates = low density HC liquids (C2 to C12)
Production Today World Liquid Fuels = ~85mbd (includes crude oil, lease condensates natural gas liquids, ethanol, CTL, GTL) World Crude Oil = ~74mbd* (includes lease condensates) Recent History of Production Predictions 2004 IEA to 121mbd by >2030 2005 IEA to 115mbdby >2030 2005 EIA to 120 mbd by >2030 2006 IEA to 116mbd by >2030 2006 EIA to 118 mbd by >2030 2006 CERA to 130 mbd by >2035 2008 EIA Projection 97 mbd 2008 CERA to 112 mbd by 2017 to 118 mbd by 2030 2009 IEA to 105mbd by 2035 2010 IEA to 96mbd by 2035 2011 Yergin to 110mbd by 2030 (WSJ 17 Sept 2011) • Christophe de Margerie • CEO Total SA • <100 mbd • <95 mbd • <90 mbd
May, 2005 to June 2010
18.7% / yr The price of oil has increased almost continuously since 1999. SRES A1 AIM scenarios expect $43 in 2020 then $73 in 2100 Today: WTI = $77 Brent = $101
Economists argument - resource constraints will be abated by technology and substitution (e.g., Helm, 2011) But This confuses substitution for increasing production at a higher price Peak Oil Paradox: Growth in the economy requires increasing oil supply But Increasing oil supply will require higher prices which tend to undermine growth.
Outline • The 4th UN IPCC Assessment Report SRES Scenarios • Oil Reserves • Hubbert’s peak • The history of US oil production • How much oil and gas will the world produce? • The Coal Question • Discussion • Future carbon-dioxide levels and temperatures • Summary
The UN Panel on Climate Change (IPCC) • The UN Intergovernmental Panel on Climate Change publishes assessment reports that reflect the scientific consensus on climate change • The 4th report (AR4) was released in 2007 • Over one thousand authors • Over one thousand reviewers • Nobel Prize • Report discusses climate simulations for fossil-fuel carbon-emission scenarios • There are 40 scenarios, each considered to be equally valid, with story lines and different government policies, population projections, and economic models AR5 will only have 3 “scenarios”
Oil Production in the IPCC Scenarios Gb = billions of barrels 1 barrel = 42 gallons = 159 liters = GJ In 13 scenarios, oil production is still rising in 2100 In none of the scenarios did oil production decrease because of resource limitation Today’s Crude Oil Production is 28 Gb y-1 182 mbd 28 14 Based on Rogner , 1997
CO2 emission Scenarios From ∑ Oil + Gas + Coal These scenarios drive almost all climate change research A2 = BAU
What is Peak Oil? There are not many Peak Oil hypotheses It’s not about Reserves! It’s all about the Production Rate! We are not close to running out of oil The Prime Directive: Never predict the future price of oil or the date of world peak oil. You will only be wrong and discredited.
OPEC Oil “Proven” Reserves! Not proven by anybody! • Accurate reserve estimates for OPEC countries are closely guarded state secrets • Values for 1983 are probably accurate (for 1983) • No adjustment for 193Gb produced since 1980 • These questionable reserves are 45% of world oil reserves used by IPCC! • Kuwait Example: A recent leak of Kuwait Petroleum Company documents showed the actual reserves are only 48Gb (official reserves are 102Gb). 1980 Kuwait reserves adjusted for production since then are 55Gb From BP Statistical Review Gb = billions of barrels
M. King Hubbert • Geophysicist at the Shell lab in Houston • In 1956, he presented a paper with predictions for the peak year of US oil production
A model logistic distribution Oil Wells and Fields Peak --- Regions Peak --- The World will peak Everyone agrees that world oil will peak – controversy on the date
DECC 2Q 2011 Gas 25% Oil 16% Both developed by private companies, using the best available technology, with virtually no restrictions on drilling, yet both regions show clearly defined production peaks. Furthermore, the initial declines in both cases corresponded to sharply rising oil prices. Contrary to conventional wisdom, Peaks Happen, even in the best of circumstances.
Mexico’s Cantarell Oil Field Cantarell oil field located 80 km offshore in the Bay of Campeche.
Mexico Was the #2 supplier of oil to the US Now is #4 Cantarell from >2,000 in 2005 to 860,000 in Jan 2009 to 588,000 in July 2009 Both Mexico and the US are in trouble. Mexico: Sale of oil = 40% of federal budget US: Net exports are decreasing fast
US Oil Consumption today is about 20.5 million barrels of oil/day ANWAR will not save us! US Production today is 5.5 mbd.
Case Study: Apply the Principals of Hubbert’s Model to the US to see how this works
Hubbert’s Peak • From Hubbert’s 1956 paper • Hubbert drew bell-shaped curves by hand, and added up barrels by counting squares • For the larger estimate, he predicted a peak in 1973 • Hubbert has been much criticized there is no consideration of supply and demand curves, prices, or policy, and new technologies Lower 48 only, Alaska not a state until 1959
US Crude-Oil Production Production is bell-shaped, like the curves Hubbert drew Average price after the peak is 2.6 times higher than before Production Price 27
Hubbert’s Model - US Case Study The model fit to the real data is not bad. The model predicts 1973. The real maximum occurred in 1970
The Logistic Curve or Rate Plot P/Q = mQ + a Q for which P/Q = 0 is 198 gigabarrels of oil. Also called Qt (maximum cumulative production) (URR) Half of this is 99 which occurred in 1973 Lower 48 A model for exponential growth in a finite system
225Gb ultimate 90% exhausted in 2011 Another Approach: Cumulative Oil Production Includes 48+Alaska • EIA data from 1859 • Fit for cumulative normal gives the ultimate production and the time for 90% exhaustion 31Gb remaining USGS/MMS 189Gb remaining
Historical Projections for US Oil The power of Hubbert’s Linearization is that it uses past behavior of a system to indicate possible future performance USGS McKelvey Hubbert 31
Can we apply this approach to estimate ultimate global oil production?
Rate Plot from 2005: Maximum Cumulative Production (Qt) = 2165 Gigabarrels ½ Qt = 1083 Gb Cumulative production of SRES A1 family = 3400Gb A2 family = 2900 Gb B family = 2790 Gb
World Crude Oil Production May Have Peaked in May 2005 IEA still predicts an increase (May 19, 2009) MBD Year
Who are the experts that IPCC turn to? Energy Information Agency (EIA) - DOE International Energy Agency (IEA) – Paris US Geological Survey (USGS) - Washington Their economic models for future emissions aredriven by demand (not supply) Price is not a factor. The EIA forecasts in 2008 projects a 30% increase in oil production between now and 2030 (from 85 to 97 mb/d) (D = +12 mbd). The hard truth is that increasing energy supply at all will be difficult. To have growth we need to balance decline of exisiting fields with discovery of new oil
Existing Oil Fields are in Decline Existing oil fields are declining at – 5 % per year (IEA 2008; Exxon, CERA, ASPO) For 2010 to 2030 the world needs 70 mbd of new production – just to maintain flat production The projected growth requires discovery of 70 + 12 = 82 mbd of new oil! 82 mbd÷ 9 mbd = 9+ new Saudi Arabias
Urban Legend – we can drill more to get more oil Oil discoveries have been declining since 1964 Middle East US The red box shows the average amount estimated to be discovered by the USGS each year between 1995 and 2025. The world’s oil provinces have been well explored. Future discoveries will be limited to smaller structures and deeper formations
Canadian Tar Sands Hugh resource = 1.7 trillion barrels surface mining (~20%) in-situ (~80%) 1.2 mbd in 2008; projected 2.4 mbd in 2020 4 barrels of water for each barrel of oil 2 tons tar sands = 1 barrel Big energy demand EROI = ~6:1 gold (natural gas) to lead (oil) Neither scaleable nor timely
Natural Gas – Shale Gas is overhyped! Shale Gas is the big news – in the US the Barnett, Haynesville, Fayetteville and Marcellus formations get the big news. But while the initial production rates are very high the first year decline rates are extremely steep. Example below from the Barnett Fm. in Texas Environmental issues (ground water contamination) associated with hydraulic fracturing (fracking) are a major issue. Arthur Berman At $7.00/Bcf requires 1.5 Bcf. Avg Barnett = 0.95 Producers claim 2.2 to 2.3 Bcf/well
What about coal? There are supposed to be hundreds of years of supply of coal! Big 3 Reserves: US (27%) Russia (17%) China (13%) then India, Australia, South Africa Remarkably the data-quality is very poor globally but especially for China (last update 1992) and SE Asia and FSU See World Energy Council (WEC) Reports
We have a big problem with coal. The reserves may not be as large as We’ve been led to believe. "Present estimates of coal reserves are based upon methods that have not been reviewed or revised since their inception in 1974, and much of the input data were compiled in the early 1970s. Recent programs to assess reserves in limited areas using updated methods indicate that only a small fraction of previously estimated reserves are actually minable reserves." from the National Academy of Sciences Report on Coal, June, 2007
The world’s proven reserves of coal are decreasing fast! Whenever coal reserves are updated the reserve estimates are revised downward (significantly). Not due to production, but rather more thorough geological surveys. Example: World Reserves by WEC decreased from 10 trillion tons to 4.2 trillion tons in 2005 Example: Gillette in Wyoming from 20.9 billion tons to 9.2 billion tons (2009) The energy content of coal mined is decreasing.
Another Problem is Energy Content IPCC reports energy units (ZJ) Types of coal (four types – different energy content) Anthracite (30 MJ/kg) Bituminous (19 – 29 MJ/kg) Sub-bituminous (8-25 MJ/kg) Lignite (5-14 MJ/kg) The high energy coal is running out US passed peak anthracite in 1950 peak bituminous in 1990 Total energy content of US coal peaked in 1998 Total energy content of world coal should peak in 2025 42 GJ = ton of oil equivalent 6.12 GJ = one barrel of oil
Energy Watch Group(2007) Coal: Resources and Future production Reserves So-called proven reserves are anything but. A key message is how fast they have been revised downward (55% in last 25 years). Major new discoveries are unlikely China (largest producer) The R/P ratio 55 yrs from 1992 at 1992 rates (now >3x faster) EWG states that China will peak in ~10 yrs China is now a net coal importer China’s reliance on coal means growth will end! USA (“the Saudi Arabia of coal”) Large Reserves but many are of low quality and high sulfur Volume will increase for another 10 to 15 years but net energy will decrease Global Picture Six countries hold 90% of reserves Rarely is coal exported The world coal energy peak will occur ~2025 Compare with IEA WEO scenarios Reference scenario is unrealistic Alternative scenario is feasible
Many independent groups are coming to the same conclusion David Rutledge – Cal Tech http://rutledge.caltech.edu Uppsala – KjellAleklett Peak Coal in 2030 (examples follow) http://www.tsl.uu.se/uhdsg/Publications/Coalarticle.pdf Energy Watch Group (EWG-Germany) Peak Coal in 2025 http://www.energywatchgroup.org/files/Coalreport.pdf Institute of Energy (IFE) Kavakov and Peteves (2007) The Future of Coal http://ie.jrc.ec.europa.eu/ Richard Heinberg Post Carbon Institute (2009) “Blackout : Coal. Climate and the Last Energy Crisis” New Society Publishers
Can we apply Hubbert’s approach to coal? UK Germany Japan Höök et al (2008)
Historical Projections for UK Coal Reserve numbers are available before projections stabilize Produced 18% of the 1871 Royal Commission reserves + cumulative Criteria were too optimistic ― 1-ft seams, 4,000-ft depth (Deffeyes’ law) 48
Projections vs Reserves for World Coal • UN IPCC scenarios assume 18Tboe is available for production from D. Rutledge