St. Thomas Grouper Fishery: Stock Assessment Insights and Management Implications
This analysis, funded by the STFA and authored by Dr. Josh Nowlis, evaluates the St. Thomas grouper fishery using extensive data sources from 1974 to 2012. Key findings indicate a mixed status for the fishery, particularly concerning the red hind species. While average sizes have increased since management actions, catch per unit effort (CPUE) suggests declining trends since 2004. The study underscores the complexity of interpreting catch data and suggests that effective management should focus on the dominant red hind species to ensure sustainable fishing practices.


St. Thomas Grouper Fishery: Stock Assessment Insights and Management Implications
E N D
Presentation Transcript
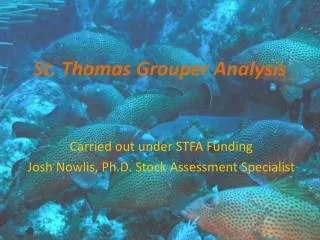
St. Thomas Grouper Analysis Carried out under STFA Funding Josh Nowlis, Ph.D. Stock Assessment Specialist
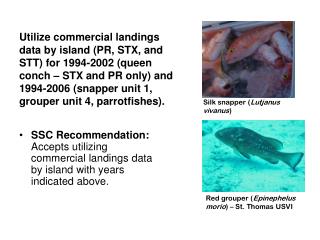
Data Sources • Catch Reports (Snapper/Grouper) 1974-1999 • Catch Reports (by Fishing Method) 1974-2012 • Catch Reports (Grouper Landings) 1997-2012 • Port Sampling (TIP) 1979-2012 • STFA Studies (2005-6, 2006, 2008, 2010-2012) • Rick Nemeth’s Red Hind Bank Studies • Olsen and LaPlace Nassau Grouper/Hind data from 1974
Reported Grouper Landings by Fishing Method Revised ACL
Estimated Total Grouper Landings= Ʃ(landings by method *% Grouper by Method)
National Standard 1 98-623 (1) Conservation and management measures shall prevent overfishing while achieving, on a continuing basis, the optimum yield from each fishery for the United States fishing industry. (28) The term "optimum", with respect to the yield from a fishery, means the amount of fish which– (A) will provide the greatest overall benefit to the Nation, particularly with respect to food production and recreational opportunities, and taking into account the protection of marine ecosystems; (B) is prescribed as such on the basis of the maximum sustainable yield from the fishery, as reduced by any relevant economic, social, or ecological factor; and (C) in the case of an overfished fishery, provides for rebuilding to a level consistent with producing the maximum sustainable yield in such fishery.
Timing of ClosureSt. Thomas Grouper Landings by Month (1999-2006)
Red Hind Total Mortality (Z) Hind Bank MCD
Implications • The St. Thomas/St. John grouper fishery shows some mixed signals. • Data limitations prevent us from doing a full species-specific analysis. We did not have Rick Nemeth’s data from 2006 to present and this needs to be examined. • We can do some focal work on the dominant species in this complex, red hind, in part because its principal spawning site has been monitored periodically since the mid-1970s. • The average size of red hind at that aggregation has increased dramatically since the temporary and then full closure of the Red Hind Bank MCD. • The average size of red hind in the catch has also been increasing, and is well above the size at 50% maturity. • The density of red hind at the aggregation has also increased markedly since the full closure of the Red Hind MCD.
Implications • Analysis of catch per unit effort data must be qualified by the problems in obtaining accurate trap hauls information since trap fishing is the primary capture method. • Catch per unit effort data present a different picture than size data. Since 2004, when data collection became sufficient to infer red hind catch levels, CPUE has been gradually declining while total mortality has been increasing. • It is difficult to present a coherent story to explain the CPUE results if we assume they are a true indication of stock decline. • Catches on this complex peaked in 2004, troughed in 2007, peaked again in 2009 and then dropped again. We do not see signals in the CPUE indices that would mirror these changes in fishing pressure. • This is consistent with Nemeth’s (pers. comm.) observations on the MCD where he is now seeing fluctuations around a stable average rather than increases.
Implications • The best conclusion we could draw, while assuming that CPUE is a valid measure of abundance, would be that the revised OFL is about right and that excessive fishing pressure since the early 2000s has led to a general decline. • The problem with this conclusion comes from examining the size information, where we see consistent evidence of increased stock health since 1990. Together with the CPUE indices, this information suggests we may have a shrinking and aging population. It is possible that the presence of larger red hind has increased mortality for younger fish, or that extrinsic factors have dampened recruitment in recent years. • Without that additional information, there are two viable strategies for St. Thomas/St. John grouper complex annual catch limits. One would be to continue allowing fishing at current levels (55,000 to 60,000 lbs), but with the recognition of a need to cut catches if average catch size or the density on spawning grounds shows signs of decline.. Ultimately this strategy would be precautionary.
Implications • Given its dominance of the complex, monitoring of red hind could be the key to an effective management strategy. • In addition to ongoing port sampling of the size distribution of catch, the CFMC could work to ensure that Dr. Nemeth's ongoing surveys of the Red Hind Bank MCD are supported and the data made available for annual stock reviews.
Recommendations • The OFL should serve as the ACL guide. • Dr. Nemeth should be funded to carry out an annual survey on the hind bank MCD. These normally take place in February to March. • Following the survey, the results should be assessed and the ACL adjusted to accounted for variations in recruitment on the MCD. • Fishermen should be involved in this review and adjustment process. • The CFMC should not only insure funding for Dr. Nemeth’s surveys but also establish a mechanism for review and adjustment (if required) of the ACL on an annual basis. • We note that this approach is similar to the manner in which many fisheries are managed (e.g.. Salmon, Alaska King crab).