Download
1 / 53
530 likes | 776 Views
18. Markets for Factors of Production. CHAPTER. C H A P T E R C H E C K L I S T. When you have completed your study of this chapter, you will be able to. 1 Explain how the value of marginal product determines the demand for a factor of production.

E N D
18 Markets for Factors of Production CHAPTER
C H A P T E R C H E C K L I S T • When you have completed your study of this chapter, you will be able to • 1Explain how the value of marginal product determines the demand for a factor of production. • 2 Explain how wage rates and employment are determined and how labor unions influence labor markets. 3 Explain how capital and land rental rates and natural resource prices are determined.
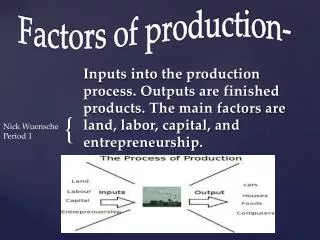
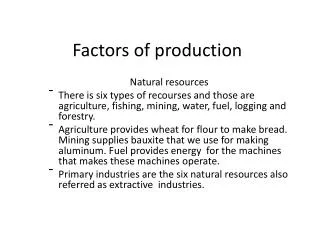
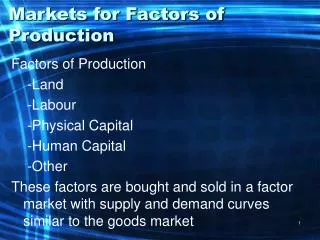
THE ANATOMY OF FACTOR MARKETS • The four factors of production that produce goods and services are • Labor • Capital • Land (natural resources) • Entrepreneurship
THE ANATOMY OF FACTOR MARKETS • Factor markets are the markets in which the services of the factors of productionare traded. • Factor prices are the prices of factors of production. • Markets of Labor Services • Labor services are the physical and mental work effort that people supply to producers of goods and services.
THE ANATOMY OF FACTOR MARKETS Markets of Labor Services • Labor services are the physical and mental work effort that people supply to producers of goods and services. • Alabor market is collection of people and firms who are trading labor services. • Ajobis a contract between a firm and a household to provide labor services.
THE ANATOMY OF FACTOR MARKETS Markets for Capital Services • Capital consists of the tools, instruments, machines, and other constructions that have been produced in the past and that businesses use to produce goods and services. • A market for capital services is a rental market—a market in which the services of capital are hired. • For example, the truck and crane rental market. • The price of capital services is a rental rate.
THE ANATOMY OF FACTOR MARKETS Markets for Land Services and Natural Resources • Land consists of all the gifts of nature—natural resources. • A market for land as a factor of production is the market for the services of land. • Most natural resources can be used repeatedly (such as a farm) but a few are nonrenewable. • Nonrenewable natural resources are resources that can be used only once—for example, oil and coal.
18.1 DEMAND FOR A FACTOR OF PRODUCTION • The demand for a factor of production is a derived demand. • It is derived from the demand for the goods and services the factor of production is used to produce. • Value of marginal productis the value to a firm of hiring one more unit of a factor of production, which equals price of a unit of output multiplied by the marginal product of the factor of production.
18.1 DEMAND FOR A FACTOR OF PRODUCTION • Value of Marginal Product • Table 18.1 on the next slide walks you through the calculation of the value of marginal product.
18.1 DEMAND FOR A FACTOR OF PRODUCTION The first two columns of the table are the firm’s total product schedule. To calculate marginal product, find the change in total product as the quantity of labor increases by 1 worker.
18.1 DEMAND FOR A FACTOR OF PRODUCTION To calculate the value of marginal product, multiply the marginal product numbers by the price of a car wash, which in this example is $3.
18.1 DEMAND FOR A FACTOR OF PRODUCTION Figure 18.1 shows the value of the marginal product at Max’s Wash ’n’ Wax. The blue bars show the value of the marginal product of the labor that Max hires based on the numbers in the table.
18.1 DEMAND FOR A FACTOR OF PRODUCTION The orange line is the firm’s value of the marginal product of labor curve.
18.1 DEMAND FOR A FACTOR OF PRODUCTION • A Firm’s Demand for Labor • A firm hires labor up to the point at which the value of marginal product equals the wage rate. • If the value of marginal product of labor exceeds the wage rate, a firm can increase its profit by employing one more worker. • If the wage rate exceeds the value of marginal product of labor, a firm can increase its profit by employing one fewer worker.
18.1 DEMAND FOR A FACTOR OF PRODUCTION • A Firm’s Demand for Labor Curve • A firm’s demand for labor curve is also its value of marginal product curve. • If the wage rate falls, a firm hires more workers.
18.1 DEMAND FOR A FACTOR OF PRODUCTION Figure 18.2 shows the demand for labor at Max’s Wash’n’ Wax. At a wage rate of $10.50 an hour, Max makes a profit on the first 2 workers but would incur a loss on the third worker.
18.1 DEMAND FOR A FACTOR OF PRODUCTION Max’s demand for labor curve is the same as the value of marginal product curve. Figure 18.2 shows the demand for labor at Max’s Wash’n’ Wax. At a wage rate of $10.50 an hour, Max makes a profit on the first 2 workers but would incur a loss on the third worker. So Max’s quantity of labor demanded is 2 workers.
18.1 DEMAND FOR A FACTOR OF PRODUCTION The demand for labor curve slopes downward because the value of the marginal product of labor diminishes as the quantity of labor employed increases.
18.1 DEMAND FOR A FACTOR OF PRODUCTION • Changes in the Demand for Labor • The demand for labor depends on • The price of the firm’s output • The prices of other factors of production • Technology
18.1 DEMAND FOR A FACTOR OF PRODUCTION • The Price of the Firm’s Output • The higher the price of a firm’s output, the greater is its demand for labor. • The Prices of Other Factors of Production • If the price of using capital decreases relative to the wage rate, a firm substitutes capital for labor and increases the quantity of capital it uses. • Usually, the demand for labor will decrease when the price of using capital falls.
18.1 DEMAND FOR A FACTOR OF PRODUCTION • Technology • New technologies decrease the demand for some types of labor and increase the demand for other types.
18.2 LABOR MARKETS • The Supply of Labor • People supply labor to earn an income. Many factors influence the quantity of labor that a person plans to provide, but the wage rate is a key factor. • Figure 18.3 on the next slide shows an individual’s labor supply curve.
18.2 LABOR MARKETS The table shows Larry’s labor supply schedule, which is plotted in the figure as Larry’s labor supply curve.
18.3 WAGES AND EMPLOYMENT 1.At a wage rate of $10.50 an hour, Larry … 2.supplies 30 hours of labor a week.
18.2 LABOR MARKETS 3.As the wage rate rises, Larry’s quantity of labor supplied … 4. increases, 5. reaches a maximum, 6. then decreases.
18.3 WAGES AND EMPLOYMENT Larry’s labor supply curve eventually bends backward.
18.2 LABOR MARKETS • Market Supply Curve • A market supply curve shows the quantity of labor supplied by all households in a particular job. • It is found by adding together the quantities of labor supplied by all households at each wage rate. • Figure 18.4 on the next slide shows the supply of car wash workers.
18.2 LABOR MARKETS This supply curve shows how the quantity of labor supplied changes when the wage rate changes, other things remaining the same.
18.2 LABOR MARKETS In a market for a specific type of labor, the quantity supplied increases as the wage rate increases, other things remaining the same.
18.2 LABOR MARKETS • Influences on the Supply of Labor • Three key factors influence the supply of labor: • Adult population • Preferences • Time in school and training
18.2 LABOR MARKETS • Adult Population • An increase in the adult population increases the supply of labor. • Preferences • There has been a large increase in the supply of female labor since 1960. • The percentage of men with jobs has shrunk slightly.
18.2 LABOR MARKETS • Time in School and Training • The more people who remain in school for full-time education and training, the smaller is the supply of low-skilled labor.
18.2 LABOR MARKETS • Competitive Labor Market Equilibrium • Labor market equilibrium determines the wage rate and employment. • Figure 18.5 on the next slide illustrates equilibrium in the market for car wash workers.
18.2 LABOR MARKETS 1.The equilibrium wage rate is $10.50 an hour. 2.The equilibrium quantity of labor is 300 workers.
18.2 LABOR MARKETS • Labor Unions • A labor unionis an organized group of workers that aims to increase wages and influence other job conditions. • In some labor markets, labor unions have a powerful effect on the wage rate and employment. • Figure 18.6 shows what happens when a union enters a competitive labor market.
18.2 LABOR MARKETS • A Union in a Competitive Labor Market • In a competitive labor market, the demand for labor is LD0 and the supply of labor is LS0, • 1. The equilibrium wage rate is $10.50 an hour and the equilibrium quantity of labor is 300 workers.
18.2 LABOR MARKETS • 2. A labor union restricts the supply of labor and the supply of labor curve shifts leftward to LS1. • 3. The wage rate rises to $15 an hour, but employment decreases to 200 workers. • Jobs are traded off for a higher wage rate.
18.2 LABOR MARKETS • 4.If union action increases labor productivity, the demand for union labor increases and the demand for labor curve shifts rightward to LD1. • 5. The wage rate rises to $20 an hour and employment increases to 250 workers.
18.2 LABOR MARKETS • How Unions Try to Increase the Demand for Labor • Unions try to change on the demand for labor by • Increasing the value of marginal product of union members • Supporting minimum wage laws • Supporting immigration restrictions • Supporting import restrictions
18.2 LABOR MARKETS • Can Unions Restrict the Supply of Labor • The union’s ability to restrict the supply of labor is limited by how well it can prevent nonunion workers from offering their labor in the same market as union workers. • It is difficult for unions to operate in markets where there is an abundant supply of willing nonunion workers.
18.2 LABOR MARKETS • The Scale of Union-Nonunion Wage Gap • How much of a difference to wage rates do unions make? • To answer this question, we must look at the wages of unionized and nonunionized workers who do similar work. • The evidence suggests that after allowing for skill differences, the union-nonunion wage gap lies between 10 percent and 25 percent.
18.3 CAPITAL AND NATURAL RESOURCE MARKETS • Capital Markets • The demand for capital is based on the value of marginal product of capital. • Profit-maximizing firms hire capital services up to the point at which the value of marginal product of capital equals the rental rate of capital. • The lower the rental rate, other things remaining the same, the greater is the quantity of capital demanded.
18.3 CAPITAL AND NATURAL RESOURCES 18.3 CAPITAL AND NATURAL RESOURCE MARKETS • The supply of capital responds in the opposite way to the rental rate. • The higher the rental rate, other things remaining the same, the greater is the quantity of capital supplied. • The equilibrium rental rate makes the quantity of capital demanded equal to the quantity supplied. • Figure 18.7 illustrates the market for the rental of tower cranes, capital used to construct high-rise buildings.
18.3 CAPITAL AND RESOURCE MARKETS • The demand curve for capital is D and the supply curve is S. 1.The equilibrium rental rate is $1,000 per day. 2.The equilibrium quantity of capital rented is 100 tower cranes.
18.3 CAPITAL AND NATURAL RESOURCES 18.3 CAPITAL AND NATURAL RESOURCE MARKETS • Land Markets • The demand for land is based on the value of marginal product of land. • Firms maximize profits by renting the quantity of land at which the value of marginal product of land equals the rental rate of land. • The lower the rental rate, other things remaining the same, the greater is the quantity of land demanded. • But the supply of land is special: The quantity is fixed. • The supply of each block of land is perfectly inelastic.
18.3 CAPITAL AND RESOURCE MARKETS Figure 18.8 illustrates the market for a given parcel of land, a 10-acre block on Chicago’s “Magnificent Mile.” The quantity supplied is 10 acres regardless of the rent. The demand curve for a 10-acre block of land is D. Equilibrium rental rate is $1,000 an acre per day.
18.3 CAPITAL AND NATURAL RESOURCE MARKETS • Nonrenewable Resource Markets • The supply side of a nonrenewable resource natural resource market is special. • Over time, the quantity of a nonrenewable resource decreases as it is used up. The stock decreases. • But the proven reserves of a natural resource increase because advances in technology enable ever less accessible sources of the resource to be discovered. • Using a natural resource decreases its supply and increases its price; new discoveries increase supply and decreaseits price.
18.3 CAPITAL AND NATURAL RESOURCE MARKETS • The Supply of a Nonrenewable Natural Resource • The owner of a nonrenewable natural resource is willing to supply any quantity for the right price. • But what is the right price? • It is the price that gives the same expected profit from supplying the resource now as holding the resource and supplying it next year. • This price is lower than the price expected next year by an amount determined by the interest rate.