Download
1 / 125
1.28k likes | 1.41k Views
Columbia River Estuary Operational Forecast System (CREOFS). Setup, Inputs, Results. Grid Development. Horizontal grid: triangular elements 74,061 nodes 142,684 elements Vertical grid: Hybrid SZ grid 54 levels: 18 z-levels from 5000m to 100m 36 s-levels in waters < 100m.

E N D
Columbia River Estuary Operational Forecast System (CREOFS) Setup, Inputs, Results
Grid Development • Horizontal grid: triangular elements • 74,061 nodes • 142,684 elements • Vertical grid: Hybrid SZ grid • 54 levels: • 18 z-levels from 5000m to 100m • 36 s-levels in waters < 100m
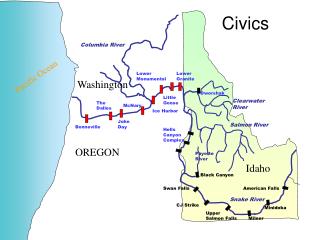
Grid Development Bonneville Dam Willamette Falls OHSU grid originally only extended to USACE station Beaver Army Terminal. An updated grid from OHSU that extends to the present boundaries was made available in the late summer 2011. A further update of spillways on the Bonneville and Willamette upstream boundaries was implemented for the hindcast simulation (but not for the tidal simulation). OHSU interpolated a recent, comprehensive bathy/topo data set on to this grid. They make simulations with depths referenced to NGVD29, while we are making our simulations with depths referenced to local MSL.
Tidal Simulation • Tides: • Foreman, M.G.G., W.R. Crawford, J.Y. Cherniawsky, R.F. Henry and M.R. Tarbottom. 2000. A high-resolution assimilating tidal model for the northeast Pacific Ocean. Journal of Geophysical Research. 105: 28,629-28,652. • Extracted from Web Tide Northeast Pacific • 8 constituents available: M2, K1, K2, N2, S2, O1, P1 and Q1 • Rivers: • from http://www.nwd-wc.usace.army.mil • Columbia River at Bonneville Dam (BONO) • Willamette River Below Falls At Oregon City (ORCO) • Lewis River at Merwin Dam (MERW) • Cowlitz River at Castle Rock (CASW) • Clackamas River • Inflows near Vancouver (1.9 x Clackamas River flow at Estacada; i.e. 1.9 x ESTO) based on recommendation from NWRFC • Flow from climatology at Fraser River (Canada).
Hindcast Simulation • Tides and rivers the same as tidal simulation. • Atmospheric Forcing: North American Regional Reanalysis (NARR). NCL programs were generated to convert the NARR netCDF files into the SELFE atmospheric netCDF format. • River Temperature: available from BONO (Columbia River at Bonneville Dam). • Ocean T/S: OHSU nudges all ocean grid nodes towards NCOM T/S. • Subtidal WL: from NCOM.
Forecast Simulations Tides the same. Subtidal from NCOM. River forecasts from NWRFC and Bonneville Power Admininstration (BPA)? Other option is persistence. Coordination with Don Laurine at NWRFC. T/S nudging from NCOM. Atmospheric forcing from NAM.
NGVD29-to-LMSL compared with bias from SELFE hindcasts Skamokawa Bias: -0.59 Datum offset: -0.61 Longview Bias: -0.95 Datum offset: -1.16 Wauna Bias: -0.69 Datum offset: -0.63 Astoria Bias: -0.40 Datum offset: -0.41 St. Helens Bias: -1.05 Datum offset: -1.33 Vancouver Bias: -1.23 Datum offset: -1.22
Water Level Comparisons at NOAA stations 9439040 Astoria 9440569 Skamokawa 9439099 Wauna 9440422 Longview 9439201 Saint Helens 9440083 Vancouver
Station: ASTORIA, TONGUE POINT, COLUMBIA RIVER Observed data time period from: / 4/ 3/2007 to / 4/ 6/2008 with gaps of 0.00 days Data gap is not filled Data are filtered using 3.0 Hour Fourier Filter ------------------------------------------------------------------------------------------- VARIABLE X N IMAX SM RMSE SD NOF CF POF MDNO MDPO WOF SKILL CRITERION - - - - - - <1% >90% <1% <N <N <.5% ------------------------------------------------------------------------------------------- SCENARIO: TIDAL SIMULATION ONLY H 88321 0.000 h 88321 0.000 H-h 15 cm 24h 88321 0.000 0.091 0.091 0.0 89.7 0.0 0.0 0.0 0.00 1.00 AHW-ahw 15 cm 24h 711 0.067 0.102 0.078 0.0 82.4 0.0 0.0 0.0 ALW-alw 15 cm 24h 711 -0.079 0.099 0.060 0.0 90.4 0.0 0.0 0.0 THW-thw 0.50 h 25h 711 -0.089 0.156 0.128 0.0 99.6 0.0 0.0 0.0 TLW-tlw 0.50 h 25h 711 -0.026 0.153 0.151 0.0 99.6 0.0 0.0 0.0 SCENARIO: HINDCAST DT = 90 seconds H 88321 -0.046 h 88321 -0.046 H-h 15 cm 24h 88321 0.000 0.126 0.126 1.1 76.7 0.4 29.4 3.2 0.76 0.99 AHW-ahw 15 cm 24h 711 0.021 0.125 0.124 1.1 76.7 0.3 74.1 0.0 ALW-alw 15 cm 24h 711 -0.023 0.114 0.111 1.0 81.0 0.1 24.7 0.0 THW-thw 0.50 h 25h 711 -0.016 0.161 0.161 0.0 98.7 0.0 0.0 0.0 TLW-tlw 0.50 h 25h 711 -0.071 0.186 0.172 0.0 98.6 0.0 0.0 0.0 SCENARIO: HINDCAST DT = 150 seconds H 45121 -0.096 h 45121 -0.095 H-h 15 cm 24h 45121 0.000 0.117 0.117 0.4 79.6 0.2 2.5 1.8 0.40 0.99 AHW-ahw 15 cm 24h 363 0.033 0.106 0.101 0.0 83.5 0.0 0.0 0.0 ALW-alw 15 cm 24h 363 -0.037 0.105 0.098 0.0 81.8 0.0 0.0 0.0 THW-thw 0.50 h 25h 363 -0.094 0.179 0.152 0.0 98.3 0.0 0.0 0.0 TLW-tlw 0.50 h 25h 363 -0.093 0.179 0.153 0.0 98.9 0.0 0.0 0.0
Station: SKAMOKAWA, COLUMBIA RIVER Observed data time period from: / 4/ 3/2007 to / 4/ 6/2008 with gaps of 0.00 days Data gap is not filled Data are filtered using 3.0 Hour Fourier Filter ------------------------------------------------------------------------------------------- VARIABLE X N IMAX SM RMSE SD NOF CF POF MDNO MDPO WOF SKILL CRITERION - - - - - - <1% >90% <1% <N <N <.5% ------------------------------------------------------------------------------------------- SCENARIO: TIDAL SIMULATION ONLY H 88321 0.000 h 88321 0.000 H-h 15 cm 24h 88321 0.000 0.076 0.076 0.0 96.0 0.0 0.0 0.0 0.00 1.00 AHW-ahw 15 cm 24h 711 0.044 0.076 0.062 0.0 96.8 0.0 0.0 0.0 ALW-alw 15 cm 24h 711 -0.025 0.049 0.042 0.0 100.0 0.0 0.0 0.0 THW-thw 0.50 h 25h 711 -0.131 0.190 0.139 0.0 98.7 0.0 0.0 0.0 TLW-tlw 0.50 h 25h 711 -0.089 0.169 0.144 0.0 99.0 0.0 0.0 0.0 SCENARIO: HINDCAST DT = 90 seconds H 81411 0.018 h 81411 0.018 H-h 15 cm 24h 81411 0.000 0.130 0.130 1.5 75.8 0.8 19.1 5.7 0.97 0.99 AHW-ahw 15 cm 24h 654 -0.072 0.145 0.127 3.7 73.1 0.0 98.8 0.0 ALW-alw 15 cm 24h 654 0.067 0.120 0.100 0.2 78.6 0.8 0.0 0.0 THW-thw 0.50 h 25h 654 -0.055 0.258 0.253 0.0 95.1 0.0 0.0 0.0 TLW-tlw 0.50 h 25h 654 -0.129 0.306 0.278 0.9 90.5 0.0 0.0 0.0 SCENARIO: HINDCAST DT = 150 seconds H 38211 -0.032 h 38211 -0.033 H-h 15 cm 24h 38211 0.000 0.115 0.115 0.1 81.0 1.0 1.2 3.6 0.54 0.99 AHW-ahw 15 cm 24h 307 -0.048 0.103 0.092 0.0 86.0 0.0 0.0 0.0 ALW-alw 15 cm 24h 307 0.022 0.076 0.073 0.0 96.4 0.0 0.0 0.0 THW-thw 0.50 h 25h 307 -0.059 0.290 0.284 0.0 91.5 0.0 0.0 0.0 TLW-tlw 0.50 h 25h 307 -0.160 0.240 0.179 0.0 96.1 0.0 0.0 0.0
Station: WAUNA, COLUMBIA RIVER Observed data time period from: / 4/ 3/2007 to / 4/ 6/2008 with gaps of 0.00 days Data gap is not filled Data are filtered using 3.0 Hour Fourier Filter ------------------------------------------------------------------------------------------- VARIABLE X N IMAX SM RMSE SD NOF CF POF MDNO MDPO WOF SKILL CRITERION - - - - - - <1% >90% <1% <N <N <.5% ------------------------------------------------------------------------------------------- SCENARIO: TIDAL SIMULATION ONLY H 88321 0.000 h 88321 0.000 H-h 15 cm 24h 88321 0.000 0.055 0.055 0.0 99.3 0.0 0.0 0.0 0.00 1.00 AHW-ahw 15 cm 24h 711 -0.023 0.059 0.054 0.0 99.0 0.0 0.0 0.0 ALW-alw 15 cm 24h 711 0.014 0.039 0.036 0.0 100.0 0.0 0.0 0.0 THW-thw 0.50 h 25h 711 0.006 0.136 0.136 0.0 99.9 0.0 0.0 0.0 TLW-tlw 0.50 h 25h 711 0.022 0.152 0.151 0.0 99.9 0.0 0.0 0.0 SCENARIO: HINDCAST DT = 90 seconds H 88321 0.055 h 88321 0.055 H-h 15 cm 24h 88321 0.000 0.154 0.154 3.7 66.2 0.7 18.7 5.5 2.50 0.98 AHW-ahw 15 cm 24h 711 -0.165 0.210 0.129 14.8 47.3 0.0 172.8 0.0 ALW-alw 15 cm 24h 711 0.142 0.173 0.099 0.1 48.0 2.7 0.0 24.7 THW-thw 0.50 h 25h 711 0.085 0.279 0.266 0.0 92.7 0.0 0.0 0.0 TLW-tlw 0.50 h 25h 711 0.044 0.202 0.197 0.0 98.0 0.1 0.0 0.0 SCENARIO: HINDCAST DT = 150 seconds H 45121 0.009 h 45121 0.010 H-h 15 cm 24h 45121 0.000 0.111 0.111 0.8 83.3 0.3 3.4 2.1 0.76 0.99 AHW-ahw 15 cm 24h 363 -0.117 0.150 0.093 2.2 63.6 0.0 0.0 0.0 ALW-alw 15 cm 24h 363 0.064 0.095 0.070 0.0 89.0 0.0 0.0 0.0 THW-thw 0.50 h 25h 363 0.048 0.313 0.310 0.0 87.9 0.0 0.0 0.0 TLW-tlw 0.50 h 25h 363 -0.096 0.206 0.182 0.0 96.4 0.0 0.0 0.0
Station: LONGVIEW, COLUMBIA RIVER Observed data time period from: / 4/ 3/2007 to / 4/ 6/2008 with gaps of 0.00 days Data gap is not filled Data are filtered using 3.0 Hour Fourier Filter ------------------------------------------------------------------------------------------- VARIABLE X N IMAX SM RMSE SD NOF CF POF MDNO MDPO WOF SKILL CRITERION - - - - - - <1% >90% <1% <N <N <.5% ------------------------------------------------------------------------------------------- SCENARIO: TIDAL SIMULATION ONLY H 88321 0.000 h 88321 0.000 H-h 15 cm 24h 88321 0.000 0.059 0.059 0.0 98.3 0.0 0.0 0.0 0.00 0.99 AHW-ahw 15 cm 24h 711 -0.028 0.068 0.062 0.0 97.7 0.0 0.0 0.0 ALW-alw 15 cm 24h 711 0.030 0.049 0.039 0.0 100.0 0.0 0.0 0.0 THW-thw 0.50 h 25h 711 0.205 0.257 0.155 0.0 97.0 0.0 0.0 0.0 TLW-tlw 0.50 h 25h 711 0.005 0.182 0.182 0.0 97.5 0.0 0.0 0.0 SCENARIO: HINDCAST DT = 90 seconds H 88321 0.226 h 88321 0.226 H-h 15 cm 24h 88321 0.000 0.162 0.162 4.9 65.7 0.9 11.6 7.7 1.89 0.97 AHW-ahw 15 cm 24h 711 -0.176 0.220 0.132 16.5 44.4 0.0 235.6 0.0 ALW-alw 15 cm 24h 711 0.137 0.174 0.107 0.0 48.0 3.7 0.0 49.5 THW-thw 0.50 h 25h 711 0.500 0.579 0.291 0.0 47.0 3.9 0.0 0.0 TLW-tlw 0.50 h 25h 711 0.074 0.224 0.212 0.0 97.3 0.1 0.0 0.0 SCENARIO: HINDCAST DT = 150 seconds H 45121 0.192 h 45121 0.192 H-h 15 cm 24h 45121 0.000 0.127 0.127 1.5 76.6 0.3 5.6 3.3 0.37 0.98 AHW-ahw 15 cm 24h 363 -0.110 0.151 0.103 3.0 65.0 0.0 0.0 0.0 ALW-alw 15 cm 24h 363 0.064 0.137 0.121 0.0 66.9 0.6 0.0 12.1 THW-thw 0.50 h 25h 363 0.360 0.487 0.328 0.0 61.7 0.3 0.0 0.0 TLW-tlw 0.50 h 25h 363 -0.149 0.242 0.191 0.0 96.1 0.0 0.0 0.0
Station: SAINT HELENS, COLUMBIA RIVER Observed data time period from: / 4/ 3/2007 to / 4/ 6/2008 with gaps of 0.00 days Data gap is not filled Data are filtered using 3.0 Hour Fourier Filter ------------------------------------------------------------------------------------------- VARIABLE X N IMAX SM RMSE SD NOF CF POF MDNO MDPO WOF SKILL CRITERION - - - - - - <1% >90% <1% <N <N <.5% ------------------------------------------------------------------------------------------- SCENARIO: TIDAL SIMULATION ONLY H 88321 0.000 h 88321 0.000 H-h 15 cm 24h 88321 0.000 0.051 0.051 0.0 99.6 0.0 0.0 0.0 0.00 0.99 AHW-ahw 15 cm 24h 711 0.006 0.062 0.062 0.0 99.2 0.0 0.0 0.0 ALW-alw 15 cm 24h 711 0.013 0.036 0.033 0.0 100.0 0.0 0.0 0.0 THW-thw 0.50 h 25h 711 0.079 0.250 0.237 0.0 94.5 0.0 0.0 0.0 TLW-tlw 0.50 h 25h 711 0.020 0.240 0.240 0.0 94.8 0.0 0.0 0.0 SCENARIO: HINDCAST DT = 90 seconds H 88321 0.413 h 88321 0.413 H-h 15 cm 24h 88321 0.000 0.156 0.156 4.4 67.4 1.5 64.3 9.3 0.93 0.97 AHW-ahw 15 cm 24h 710 -0.077 0.158 0.138 7.2 71.0 0.0 247.1 0.0 ALW-alw 15 cm 24h 710 0.088 0.185 0.163 2.3 50.7 6.3 60.7 99.2 THW-thw 0.50 h 25h 710 0.589 0.692 0.365 0.1 41.3 10.3 0.0 24.7 TLW-tlw 0.50 h 25h 710 -0.001 0.248 0.248 0.1 94.6 0.0 0.0 0.0 SCENARIO: HINDCAST DT = 150 seconds H 45121 0.396 h 45121 0.396 H-h 15 cm 24h 45121 0.000 0.179 0.179 4.6 52.7 2.6 86.0 8.7 1.50 0.96 AHW-ahw 15 cm 24h 363 -0.022 0.147 0.145 3.0 67.8 0.3 73.2 0.0 ALW-alw 15 cm 24h 363 0.025 0.220 0.218 6.3 34.7 9.1 86.9110.2 THW-thw 0.50 h 25h 363 0.521 0.619 0.335 0.0 42.7 5.8 0.0 38.3 TLW-tlw 0.50 h 25h 363 -0.218 0.332 0.251 0.0 85.1 0.0 0.0 0.0