Sediment Quality Objectives Indirect Effects Project
580 likes | 603 Views
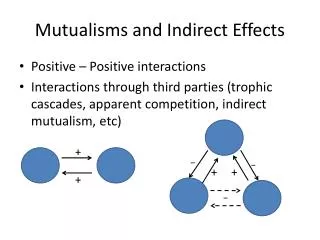
Sediment Quality Objectives Indirect Effects Project. Ben Greenfield Aroon Melwani John Oram Mike Connor San Francisco Estuary Institute (SFEI). Presentation Overview. Project conceptual framework Description of Multiple Lines of Evidence Use of information in assessment context

Sediment Quality Objectives Indirect Effects Project
E N D
Presentation Transcript
Sediment Quality ObjectivesIndirect Effects Project Ben Greenfield Aroon Melwani John Oram Mike Connor San Francisco Estuary Institute (SFEI)
Presentation Overview • Project conceptual framework • Description of Multiple Lines of Evidence • Use of information in assessment context • Methodological issues and results • Empirical and mechanistic approaches • Problems of scale, target species • BAF vs. BSAF
Pollutant Groups • Dioxins • PBDEs Non-ionic organics PCBs DDTs Chlordanes Dieldrin Methylmercury
Conceptual Model Exposure Assessment Effects Thresholds For Humans Effects Thresholds For Wildlife/Fish Chemical uptake via diet, respiration Effects Assessment
Multiple Lines of Evidence Approach Exposure Assessment Effects Thresholds For Humans Effects Thresholds For Wildlife/Fish Chemical uptake via diet, respiration Effects Assessment
Sources of Variability • Exposure: • Diet • Lipids & Weight • Spatial movement • Chemical Partitioning • Effects: • Consumption Rate • Size • Risk management goals • Uncertainty will be addressed by: • Using multiple lines of evidence • Incorporating several thresholds into each line of evidence • Unlikely risk • Potential risk to high-risk consumers • Potential risk to average consumers • High risk to average consumers
Indirect Effects Weight of Evidence Human Lines of Evidence Fish and Wildlife Lines of Evidence Fish Concentration Fish Concentration Laboratory Bioaccumulation Concentration Laboratory Bioaccumulation Concentration Sediment Concentration Sediment Concentration
Indirect Effects Approach Compared to Rest of SQO Program • Similarities: • Integrate multiple lines of evidence • Use ordinal scale ranking based on thresholds • Both exposure and effects are important • Changes: • All lines of evidence are measures of exposure • Effects thresholds are determined from literature/expert opinion • If local effects information are available, they would be included on a case-by-case basis • All effects assessments are specific to individual contaminants (mixtures not accounted for) • Addition of laboratory bioaccumulation component
F Multiple Effects Thresholds:Fish Targets for Human Health • Screening values for human consumption of edible fish tissue • Tissue thresholds developed using USEPA and CalEPA reference doses and cancer slope factors • Separate thresholds will be calculated assuming varying levels of risk • Cancer Risk 1x10⁻⁴ - 1x10⁻⁶ • Assuming 70 kg adult with 70 yr lifetime • Consumption rate assumptions will also be varied • OEHHA consumption rate of 21 g/d. • USEPA consumption rate of 17.5 g/d. • Other consumption rates will be considered • E.g., 6.3 g/d rate for all anglers consuming fish in SF Bay • E.g., 142.4 g/d EPA rate for subsistance fishers
F Multiple Effects Thresholds:Fish Targets for Human Health • Development of four categories • Category 1 = Unlikely risk • Below all thresholds • Category 2 = Potential risk to high-end consumers • Above threshold using higher consumption rate assumption and protective allowable risk (10-6) • Category 3 = Potential risk to average consumers • Above threshold using sport fisher consumption rate with intermediate allowable risk (10-5) • Category 4 = High risk to average consumers • Sport fisher consumption rate with less protective allowable risk (10-4)
Multiple Effects Thresholds:Sediment Targets for Human Health S • Numeric targets - again 4 categories • Based on field sediment concentrations at which fish tissue concentrations would exceed target concentrations • When local data are available, targets developed for specific water body • When local data are not available, general targets will be recommended • These will account for uncertainty and will span a range of conditions • Calculated based on concentration ratio between sediment and biota • Using statistical and mechanistic models (more later…)
Multiple effects thresholds:Laboratory BioaccumulationTargets for Human Health L • Numeric targets - again 4 categories • Based on concentrations observed in 28 day laboratory bioaccumulation tests • Tests on sediments to be evaluated • Important link between sediments and indirect effects • Confirm whether specific sediments are likely to cause exposure to biota • Also important for contaminants that do not bioaccumulate in finfish (e.g., PAHs) • Our current thinking: evaluate risk due to consumption of contaminated shellfish
F Multiple Effects Thresholds:Fish and Laboratory BioaccumulationTargets for Wildlife L • Thresholds for bird and wildlife consumption of fish or shellfish • Thresholds will be calculated and presented in tabular form for sensitive and endangered wildlife species • Tables can be used by local agencies based on local species • For PCBs and DDT, thresholds will be based on work of Biological Technical Assistance Group (BTAG) • Low and high Toxicity Reference Values used to establish multiple targets • Field fish samples and laboratory invertebrate samples are to be evaluated as separate lines of evidence • All thresholds will be reviewed by a Bioaccumulation Work Group, formed specifically for the indirect effects task
Sensitive and Endangered Target Species • Least Tern • Clapper rail • Brown pelican • Western snowy plover • Bald eagle • Southern sea otter • Harbor seal • Tidewater goby • Salmonids
Multiple Effects Thresholds:Sediment Targets for Wildlife S Same approach as with sediment targets for humans. I.e.,… • Numeric targets • Based on field sediment concentrations at which fish tissue concentrations would exceed target concentrations • Calculated based on Biota Sediment Accumulation Factor • Using statistical and mechanistic models (more later…)
Use in Assessment:Integration of Lines of Evidence • Four categories for each line of evidence • Category 1 = Unlikely risk • Category 2 = Potential risk to high-end consumers • Category 3 = Potential risk to average consumers • Category 4 = High risk to average consumers 1 2 3 4 F L S 1 2 3 4 1 2 3 4
Five Categories For SQO Evaluation A = Sediment meets SQO with high certainty (i.e., is protective) B = Sediment probably meets SQO, but some uncertainty is present C = Sediment possibly fails SQO, but data are inconsistent D = Sediment likely fails SQO E = Sediment highly likely to fail SQO
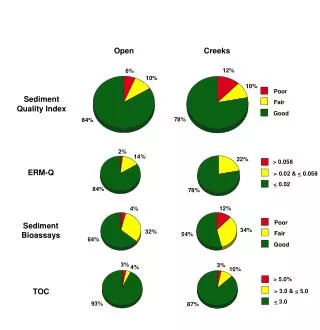
Statewide Assessments Will Be Conducted F Human Health US EPA SV x 10 ~ 90% meet criteria Least Tern High Effects SV (1632 ug/kg)– 100% meet criteria Least Tern Low Effects ~ 70% meet criteria Human Health US EPA SV ~ 10% meet criteria (Fish Species included: Bay Goby,California Halibut,English Sole,Longfin Sanddab,Pacific Sanddab,Pacific Staghorn Sculpin,Shiner Surfperch, Slender Sole,Speckled Sanddab, Starry Flounder, White Croaker, andWhite Surfperch)
Methodological issues • Overall approach for development of biota-sediment relationship • Scale of analysis • At what scale can data be extrapolated for biota-sediment relationship development? • At what scale should movement range be extrapolated over? • Target fish and laboratory bioaccumulation species • BAF vs. BSAF
Overall Approach to DevelopBiota to Sediment Relationship • Empirical Models – Concentrations in Organisms, Concentrations in Sediment, Other Factors • Mechanistic Models – Quantification of Bioenergetics and Physicochemical Properties and Concentrations. • Data-intensive (e.g., bioenergetics, life history, chemical-specific properties)
Empirical modeling approach: • Linear Regression Models Using SQO database and other data. 40 30 High toxicity Threshold 4 20 Biota Concentration Low toxicity Threshold 2 10 0 0 2 4 6 8 10 Sediment Concentration
DDTs in San Francisco Bay Macoma clams vs. sediment 100 2 R = 0.6585 10 Tissue DDT (ug/kg dry) 1 1 10 100 1000 0.1 Sediment DDT (ug/kg dry) Results are from 28 day laboratory bioaccumulation tests
Bivalve concentrations compared to co-located sediments. • Fish concentrations compared with sediments in a disk centered at each fish sampling location. • Disk size ranged from 0.5 - 15 km (0.5 km increments) • No a priori assumptions about fish home range
?? Total PCBs R2 results of distance relationships of sediment and shiner surfperch data in San Francisco Bay Linear regression of Total PCB concentration in sediment vs. Shiner Surfperch tissue in San Francisco Bay (p<0.05)
Total DDTs R2 results of distance relationships of sediment and shiner surfperch data in San Francisco Bay Linear regression of Total DDT concentration in sediment vs. Shiner Surfperch tissue in San Francisco Bay (p<0.05)
Mechanistic modeling approach • Calculate Biota-Sediment Accumulation Factors and SQO using mechanistic models at local scales • Demonstrate use of mechanistic model for multiple contaminants in two case studies • Evaluate confounding factors • Water contamination • Home range size • Diet • Using Gobas model (e.g., TrophicTrace, Arnot and Gobas 2004) • Validating with available empirical data
Basic Mechanistic Model Elements • Uptake • Dietary • Gill • Loss • Excretion • Egestion • Gill Elimination • Metabolism Growth Chemical properties (e.g., Kow) important
Data Needs • Minimum: diet and biology • Dietary preference • Weight, lipid content • Preferrable: • Contaminant concentrations in sediment, water, inverts, fish
Newport Bay case study: Developing conceptual food web model Preliminary model kindly provided by M. James Allen, SCCWRP
Macoma nasuta - Total HPAHs 6 R2 = 0.7042 (SD) R2 = 0.3771 (SP) 5.5 R2 = 0.1982 (SF) R2 = 0.0027 (TOM) 5 4.5 4 3.5 3 2.5 2 1.5 1.5 San Diego San Pedro SF Tomales Linear (SF) Bivalve Tissue Concentration (log x+1, ug/kg, dry wt.) Linear (San Diego) Linear (Tomales) Linear (San Pedro) 2 2.5 3 3.5 4 4.5 5 5.5 6 Sediment Concentration (log x+1, ug/kg, dry wt.) Macoma nasuta tissue data indicate different results for different water bodies. E.g., total PAHs tissue concentrations lower at given sediment concentration in San Francisco Bay - suggest water body specific BSAFs
Identify Good Target Species Prey For Humans and Wildlife Limited Variation in Diet or Home Range Sediment Linkage
Macoma nasuta is a good species for Laboratory • Bioaccumulation test • -Recommended for bed sediment testing (EPA guidance) • -Deposit feeder with high contaminant tolerance • -Large California database available • Species with existing data in SQO database
Starry Flounder Summary of regression analysis of individual fish species vs. summed contaminant concentrations in sediment collected within 2 km of fish samples * = significant linear relationship (p<0.05)
Total PCBs Spatial patterns in total PCB concentrations and stable isotope signatures suggest site fidelity for shiner perch in the San Francisco Estuary
Map of San Francisco Bay showing locations of sediment, Shiner surfperch and Macoma nasuta collections used for empirical modeling of Biota Sediment Accumulation Factors