Download
1 / 38
380 likes | 398 Views
Explore the study of human population distribution and migration, including population concentrations and variations. Learn about population growth, demographic cycles, and the stages of the Demographic Transition Model.

E N D
Unit II. Population A. Population Demographics 1. Concentrations 2. Variations 3. Pyramids B. Population movement 1. Push and pull factors 2. Major voluntary and involuntary migrations at different scales 3. Migration selectivity 4. Short-term, local movements, and activity space C. Population Policies 1. Pro-Natalists vs. Anti-Natalists 2. Thomas Malthus / Over Population Concerns 3. Eugenics
Population • Demographics is the study of human population distribution and migration. • Key Issues of Demographics are: • Food Supply • Health and life expectancy • Status of women • Migration
People are NOT distributed evenly across the Earth. Population is clustered in the mid latitude climates and relatively sparse in the dry and polar climates or the highlands.
Arithmetic density is the total number of people divided by the total land area. The highest population densities are found in Asia, Europe and Central America.
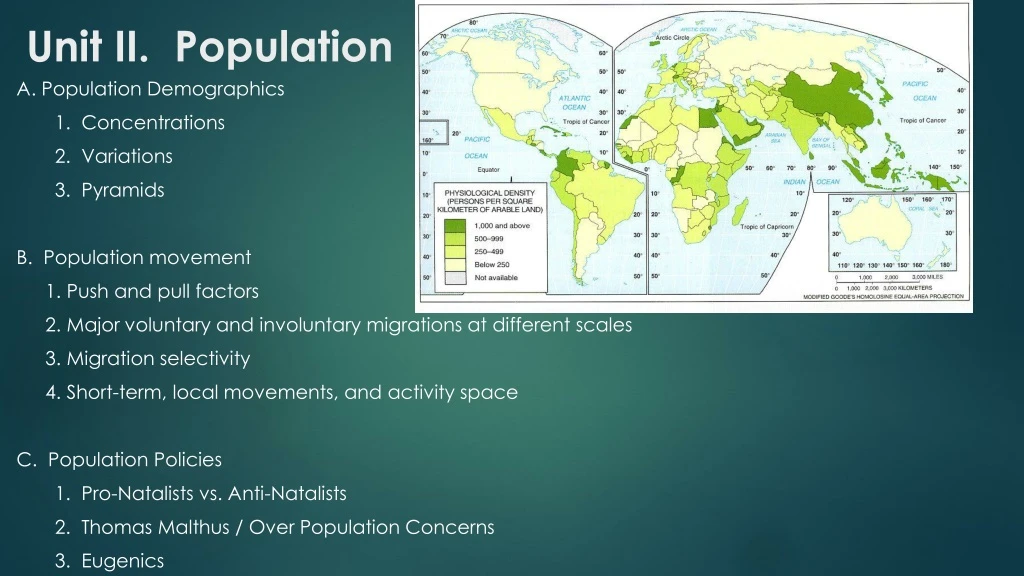
Population Density Types • Arithmetic density is the total number of people divided by the total land area. The highest population densities are found in Asia, Europe and Central America. • Physiological density is the number of people per unit of arable land, which is land suitable for agriculture. Physiological density is a better measure than arithmetic density of the relationship between population and resources. Even physiological density can be misleading since it does not consider the productivity of the soil or the resources and expertise of the farmers.
Major Population Concentrations • Eastern North America • Megalopolis Boston to Washington, D.C. which includes New York and Philadelphia. • West along Great Lakes to Chicago • Mostly urban • < 5% Farmers
Major Population Concentrations • Europe (Western) • Over700 million. • 75% to 90% living in cities. • < 20% farmers • Dense road & rail networks • Import food & resources • Motivation for colonization Closely spaced houses in Amsterdam, Netherlands
Major Population Concentrations • South Asia • 2nd largest population cluster. • Dense pop. follows the Ganges and Indus rivers. • Bangladesh (size of Iowa) with 141 million (1/2 of total U.S. pop) • 14 cities over 2 million • Still ¾ rural population • East Asia • 1/4 of the world’s population is here • Concentration along coast and rivers in China • Most people are farmers, not city dwellers in China • Japan and Korea • 3 major urban centers, • ¾ urban pop
Population Growth • From Dawn of History to 1820 to reach 1 billion • 1820-1930 to reach 2 billion • 1970s only 12 years to add another billion. • Then a decade for another billion. • A growth rate of 1 billion people per decade. • By 1997 growth rate was 1.5% - today 1.4%
Population Growth • Natural Increase Rate – NIR • Based on CBR and CDR only • Does NOT include migration • Tiny % NIR = Huge pop changes • 2010 World NIR = 1.4% (1963=highest, 2.2%) • NIR almost entirely in LDC • Impacts doubling time • Total Fertility Rate – TFR • Average # children/woman • Averages < 2 in MDC and >6 in many LDC • Mortality • 2 measures = infant mortality rate & life expectancy • IMR reflects health care • CDR does NOT vary directly with MDC vs. LDC • Ex. U.S. CDR higher than Mexico due to stages of demographic transition
Total Fertility Rate (TFR) of 2.1 to 2.5 children per woman is considered “replacement level.”
Demographic cycles of population growth • Stage 1 High Stationary Growth with high birth rates 40/1000 or higher and high death rates. • Stage 2 Early Expanding with high birth rates and declining death rates (birth 40s/death 20/1000) = rapid growth in pop. • Stage 3 Late Expanding with declining birth rates (30s) and low death rates (10s) = still significant growth • Stage 4 Low Stationary has low birth rates and low death rates (birth 15 and death 10 or lower) SPL Stationary Population Level
Demographic Transition Model Explained • Stage 1 has virtually no growth rate with very high birth and death rates. Most of human existence was in Stage 1 of the Demographic Transition model. Today no country is in this category. • Stage 2 has rapidly declining death rates and very high birth rates to produce population growth. In the late 18th and early 19th centuries several countries moved to stage 2 as the Industrial Revolution took place. Africa, Asia and Latin America reached Stage 2 not because of an Industrial Revolution, but a medical revolution invented in Europe and North America and diffused to these places. • Stage 3 European and North American countries moved from Stage 2 to Stage 3 in the first half of the 20th cent. Most of Asia and Latin America moved to Stage 3 in the last half of the 20th cent. while Africa remained in Stage 2. Nations enter Stage 3 when people decide to have fewer kids since living in cities and working in factories or offices requires fewer people. • Stage 4 When the crude birth rate equals the crude death rate zero population growth is achieved or Stage 4.
Population Variations • Distribution • ¾ of the world’s population lives on only 5% of the land. • Very uneven distribution intensified in 20th cent. as population soared. • 2/3 of the pop. lives near an ocean or river. • Ecumene • Tech can/has increased ecumene and carrying capacity • Unlivable areas declining • Dry Lands (20% of planet) between 15-50 degrees lat. • Equatorial wet lands • Cold lands – permafrost, polar deserts • High lands (some exceptions in mts. of S. Am. & Africa)
Some Basic Vocabulary* • Domestic migration: moves that cross jurisdictional boundaries • Residential mobility: moves within the same jurisdiction • Moving rate: percentage of people who changed residence in a 1-year period *U.S. Census Bureau. Current Population Reports, March 2004.
Movement at the individual scale is affected by three factors: • Accessibility, i.e., “where you are” • Opportunities • Distance • Mobility, i.e., “who you are” • Age • Income • Availability of car or public transportation • Mental maps, i.e., “what you know” • Perception of what is where • Perception of danger
U.S. Population Mobility • Between 2002 and 2003, 40.1 million U.S. residents moved • More than half of all moves were local (i.e., within the same county) • Young adults had the highest moving rates (about one-third of 20-29 year olds in 2003) • Older adults had the highest interstate moving rates (28% of all 55 and older movers crossed state lines in 2003) • Hispanics and African American had the highest overall moving rates (18% in 2003) • Factors most influencing moving rates were age and home ownership Source:U.S. Census Bureau. Current Population Reports, March 2004.
National Mean United States: Changing Residence 1995-2000
Movers to South Carolina1995-2000 Beware the fallacy of absolute truth. What is true at one scale may not be true at a different scale. Moved from a Different State Source: U.S. Census Bureau, Census 2000, Summary File 3 [online]
Region to Region Movement, March 1999 to 2000 Movers to the Midwest Moved from Source: U.S. Census Bureau, Census 2000, Summary File 3 [online]
Region to Region Movement, March 1999 to 2000 Movers to the South Moved from Source: U.S. Census Bureau, Census 2000, Summary File 3 [online]
Region to Region Movement, March 1999 to 2000 Movers to the Northeast Moved from Source: U.S. Census Bureau, Census 2000, Summary File 3 [online]
Region to Region Movement, March 1999 to 2000 Movers to the West Moved from Source: U.S. Census Bureau, Census 2000, Summary File 3 [online]
Questions to Guide Analysis • How does your state compare to the rest of the country in term of mobility rates? Is it above or below the national mean? • What factors may account for your state’s mobility status? • Describe patterns of mobility within your state. • Which counties have experienced above average mobility? Which fall below average? How do you account for these patterns? • If your parents are “local,” how has your state, county, or community changed since they were in high school? Which changes are a product of mobility trends?
Identify examples of push-pull factors contributing to changing residence in the U.S.
Accessibilityand Mobility: Evaluating Activity Space • Interview 3 people in different households and age groups concerning their movements over a 24 –hour period. • 14 and under • 15-20 • 21+ • Document their travel routes for the entire day. • Chart the travels on a map. Each person should be accurately identified on the map. • How does age affect mobility? • What factors limit or enable the mobility of persons in different age groups?
Population Policies Pro-natalist / Expansive Anti-natalist / Restrictive
U.S.S.R. - pro-natalist Motherhood Medal 5 children 8,000,000 awarded Motherhood Medal 6 children 4,000,000 awarded Starting on July 8, 1944 the government of the U.S.S.R. began awarding medals to women in order to encourage a high fertility rate. Order of Maternal Glory 7 children 2,000,000 awarded Order of Maternal Glory 2nd Class 8 children 1,000,000 awarded Order of Maternal Glory 1st Class 9 children 500,000 awarded Order Mother Heroine 10 children 200,000 awarded
Germany Cross of Honor of the German Mother (Ehrenkreuz der deutschen Mutter) Bronze 3rd Class Mother’s Nazi Cross 4, 5 Silver 2nd Class Mother’s Nazi Cross 6, 7 Gold 1st Class Mother’s Nazi Cross 8 or more Diamond – 14 or more http://www.nobeliefs.com/mementoes.htm 1938 - 1944
Why would a country want an anti-natalist policy ? 80,000 Family Planning Workers
China - anti-natalist: 2 different programs in recent years • Later, Longer, Fewer Policy • One ChildPolicy • Rewards • free medical care • free daycare and schooling • guaranteed job for child • bonuses for parents • extra maternity leave • better housing • bigger old age pension • Penalties • must repay financial • benefits • educational, medical • benefits, & guaranteed • jobs are withdrawn • parents’ wages reduced • get married later in life (mid - late twenties) • wait longer for first baby and in between babies • have fewer, 2 in urban areas & 3 in rural areas
Iran: - Started as Anti-natalist, shifted to Pro-natalist, then went back to Anti-atalist. • 1967 – first anti-natalistpolicy • start of family planning • accelerating economic growth • slow rapid growth (2.75%) • 1979 – pro-natalist • start of Islamic Revolution • family planning program eliminated • promotion of contraception banned • 8 year war with Iraq encouraged procreation • 1988 – anti-natalist • faltering economy • severe unemployment • overcrowded & polluted cities
1988 – 2001 National family planning program was revived • Encouraged women to wait 3 – 4 years between children • Discouraged childbearing for those < 18 and > 35 • Restricted maternity leave after 3 children • Limited family size to 3 children • Family planning & mother / infant health care information incorporated into school curriculum • Government controlled media promoted family planning • Religious leaders supported the gov’n’tplan • All couples take a class on modern contraception before marriage • Gov’n’t. sanctioned condom factory, free birth control and sterilization • Investment in literacy (between 1970 & 2001) • males (48% – 84%) females (25% - 70%)** • Total fertility rate dropped < 3
2006 "It is said that two children is enough. I oppose this," President Mahmoud Ahmadinejad told legislators. "Our country has a lot of capacities. It even has the capacity for 120 million people.“ reduction in working hours for women to allow for more child bearing & rearing Iranian President from 2005-2013
Since the mid-1960s, Singapore's government has attempted to control the country's rate of population growth with a mixture of publicity, exhortation, and material incentives and disincentives • 1969 – 1972 population disincentives • raise cost of 3rd and subsequent children • civil servants received no paid maternity • leave for 3rd + • income tax deductions for 2 only • maternity hospitals charged progressively more for each additional child • enrollment to top primary schools went to children of pre – 40 sterilized parents
Eugenic: favor one racial sector over others (e.g., Japan, US up until the civil rights movement (1960s), Nazis are an extreme example of eugenics)