Download

1 / 4
40 likes | 142 Views
Medicare spending disproportionately favors seniors with moderate/severe disabilities over those without. This data brief analyzes the significant differences in spending across different residence settings. Opportunities for cost-effective care under the Affordable Care Act are discussed.

E N D
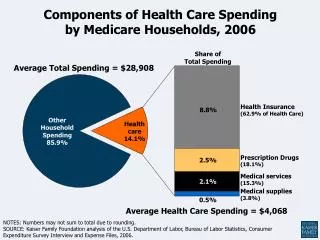
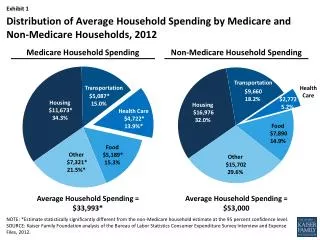
Differences in Medicare Spending by Disability and Residence DataBrief Series ● September 2011 ● No.17 Medicare spends almost four times more per capita on health care for seniors with moderate or severe disabilities than for those withoutdisabilities?
Seniors with Disabilities and Medicare Spending • In 2006, Medicare spent $16,517 per capita on health services for seniors with moderate or severe disabilities. In comparison, Medicare spent $4,395 per capita on health services for seniors without disabilities.1,2 • People with moderate or severe disabilities typically require supportive services to assist with activities of daily living. They may live in nursing homes (38%), their homes or apartments (49%), or residential care settings such as assisted living facilities, domiciliary care facilities, or continuing care retirement communities (9%).1 • LTSS provided in these settings is paid for by Medicaid, through out-of-pocket payments, and to a much lesser degree, through private long-term care insurance (LTCi). In addition, seniors with moderate or severe disabilities receive a great deal of assistance from unpaid family caregivers.3 • Medicare spending varies somewhat according to the setting in which seniors with moderate or severe disabilities live. For seniors with moderate or severe disabilities, Medicare spent $14,594 per capita on nursing home residents, $14,001 per capita on residential care residents, and $18,308 per capita on community residents in 2006.1,2 1 Avalere Health, LLC analysis of the 2006 Medicare Current Beneficiary Survey, Cost and Use file. Excludes beneficiaries who died in 2006. 2 Includes spending on inpatient hospital, outpatient hospital, physician, emergency department, skilled nursing facility, home health, and hospice. Excludes prescription drugs, DME, and miscellaneous Medicare spending. 3 The SCAN Foundation (2011). DataBrief No. 13: Sources of Long-Term Care Spending. Accessed on May 11, 2011 at: http://www.thescanfoundation.org/foundation-publications/databrief-no-13-sources-long-term-care-spending. DataBrief (2011) ● No. 17
Medicare Spends More Per Capita on Seniors with Moderate or Severe Disabilities Than on Seniors without Disabilities1 Total Per Capita Medicare Spending For Beneficiaries with Disabilities, by Residence Setting, 20062 Total Per Capita Medicare Spending By Level of Disability, 20062 1 Seniors with moderate or severe disability includes community residents and residential care residents with 2 or more Activities of Daily Living (ADL) needs and all nursing home residents. N= 1,161,759 community residents with 2+ ADLs, 202,161 residential care residents with 2+ ADLs, 817,954 nursing home residents, and 24,553,318 community and residential care residents with no disabilities. Excludes beneficiaries who died in 2006. 2 Includes spending on inpatient hospital, outpatient hospital, physician, emergency department, skilled nursing facility, home health, and hospice. Excludes prescription drugs, DME, and miscellaneous Medicare spending. 3 The differences in spending between all 3 residence settings are statistically significant at the p = 0.05 level. DataBrief (2011) ● No. 17
A Clear Policy Connection In 2006, Medicare spent significantly more per capita for seniors with moderate or severe disabilities than for seniors without disabilities. This difference in spending persisted across residence settings. Much of this difference in spending could be explained by the presence of a disability. The Affordable Care Act (ACA) provides opportunities to reduce Medicare spending while maintaining or improving the quality of care provided to beneficiaries. For example, the Medicare Shared Savings Program is one program that is targeted to accountable care organizations (ACOs)—teams of doctors, hospitals, and other health care providers who will work together to better integrate care for patients. The program is voluntary and will reward ACOs that meeting cost savings requirements and other performance standards. Additionally, ACOs will be at-risk if they fail to provide efficient, cost-effective and high quality care.1 Though led by primary care providers, the success of ACOs participating in the Shared Savings Program will depend not only on their ability to coordinate medical services across provider settings, but also to integrate community-based supportive services to better address disability that may be driving health care costs. Other similar opportunities provided by the ACA include medical/health homes and the Independence at Home demonstration. • This analysis is based on the 2006 Medicare Current Beneficiary Survey (MCBS) Cost and Use file, an annual, longitudinal survey of a representative sample of all Medicare enrollees. The MCBS collects information on residence setting, level of disability, health services utilization, and health spending. • This analysis is limited to respondents in the community and residential care settings who indicated that they received help or standby assistance in two or more ADLs (eating, bathing, dressing, toileting, or transferring). It includes all nursing home residents and assumes that all nursing home residents have at least that level of disability or LTSS need. • Residential care is defined as assisted living facilities, retirement communities, continuing care communities, and other types of residential care facilities. • This analysis is also limited to individuals age 65 or older who are enrolled in the fee-for- service, or traditional, Medicare program. It excludes beneficiaries who had any Medicare Advantage spending in 2006 and excludes beneficiaries who died in 2006. 1 Centers for Medicare and Medicaid Services. What Providers Need to Know: Accountable Care Organizations. April 2011. Accessed July 19, 2011 http://www.cms.gov/MLNProducts/downloads/ACO_Providers_Factsheet_ICN903693.pdf. DataBrief (2011) ● No. 17