Download
1 / 19
210 likes | 580 Views
BOSTON CONSULTING GROUP MATRIX. PRESENTED BY: ESHA SHAH NEHA SARAF MONTU KANSARA. INTRODUCTION. BOSTON CONSULTING GROUP (BCG) MATRIX is developed by BRUCE HENDERSON of the BOSTON CONSULTING GROUP IN THE EARLY 1970’s.

E N D
BOSTON CONSULTING GROUP MATRIX PRESENTED BY: • ESHA SHAH • NEHA SARAF • MONTU KANSARA
INTRODUCTION • BOSTON CONSULTING GROUP (BCG) MATRIX is developed by BRUCE HENDERSON of the BOSTON CONSULTING GROUP IN THE EARLY 1970’s. • According to this technique, businesses or products are classified as low or high performers depending upon their market growth rate and relative market share.
Relative Market Share and Market Growth To understand the Boston Matrix you need to understand how market share and market growth interrelate.
MARKET SHARE • Market share is the percentage of the total market that is being serviced by your company, measured either in revenue terms or unit volume terms. • RELATIVE MARKET SHARE • RMS = Business unit sales this year Leading rival sales this year • The higher your market share, the higher proportion of the market you control.
MARKET GROWTHRATE • Market growth is used as a measure of a market’s attractiveness. • MGR = Individual sales - individual sales this year last year Individual sales last year • Markets experiencing high growth are ones where the total market share available is expanding, and there’s plenty of opportunity for everyone to make money.
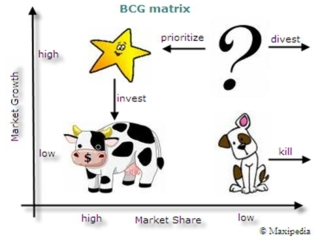
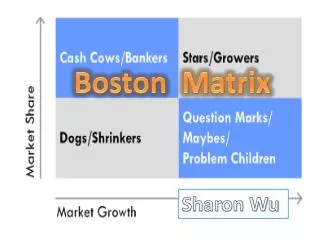
THE BCG GROWTH-SHARE MATRIX • It is a portfolio planning model which is based on the observation that a company’s business units can be classified in to four categories: • Stars • Question marks • Cash cows • Dogs • It is based on the combination of market growth and market share relative to the next best competitor.
STARSHigh growth, High market share • Stars are leaders in business. • They also require heavy investment, to maintain its large market share. • It leads to large amount of cash consumption and cash generation. • Attempts should be made to hold the market share otherwise the star will become a CASH COW.
CASH COWS Low growth , High market share • They are foundation of the company and often the stars of yesterday. • They generate more cash than required. • They extract the profits by investing as little cash as possible • They are located in an industry that is mature, not growing or declining.
DOGSLow growth, Low market share • Dogs are the cash traps. • Dogs do not have potential to bring in much cash. • Number of dogs in the company should be minimized. • Business is situated at a declining stage.
QUESTION MARKSHigh growth , Low market share • Most businesses start of as question marks. • They will absorb great amounts of cash if the market share remains unchanged, (low). • Why question marks? • Question marks have potential to become star and eventually cash cow but can also become a dog. • Investments should be high for question marks.
WHY BCG MATRIX ? To assess : • Profiles of products/businesses • The cash demands of products • The development cycles of products • Resource allocation and divestment decisions
MAIN STEPS OF BCG MATRIX • Identifying and dividing a company into SBU. • Assessing and comparing the prospects of each SBU according to two criteria : 1. SBU’S relative market share. 2. Growth rate OF SBU’S industry. • Classifying the SBU’S on the basis of BCG matrix. • Developing strategic objectives for each SBU.
BENEFITS • BCG MATRIX is simple and easy to understand. • It helps you to quickly and simply screen the opportunities open to you, and helps you think about how you can make the most of them. • It is used to identify how corporate cash resources can best be used to maximize a company’s future growth and profitability.
LIMITATIONS • BCG MATRIX uses only two dimensions, Relative market share and market growth rate. • Problems of getting data on market share and market growth. • High market share does not mean profits all the time. • Business with low market share can be profitable too.
PRACTICAL USE • MAHINDRA & MAHINDRA • HLL • IES
BCG MATRIX scorpio Jeep balero
CONCLUSION Though BCG MATRIX has its limitations it is one of the most FAMOUS AND SIMPLE portfolio planning matrix ,used by large companies having multi-products.