Download
1 / 100
1k likes | 1.23k Views
The Great Recession: Subprime Meltdown. Michael Ka Yiu Fung Professor in Business Economics CUHK Business School. The Great Depression. August 1929 – March 1933: Duration: 43 months Highest unemployment rate: 24.9%. The Great Depression. August 1929 – March 1933:

E N D
The Great Recession:Subprime Meltdown Michael Ka Yiu Fung Professor in Business Economics CUHK Business School
The Great Depression • August 1929 – March 1933: • Duration: 43 months • Highest unemployment rate: 24.9%
The Great Depression • August 1929 – March 1933: • Highest unemployment rate: 24.9% • Change in real GDP: -28.8%
The Great Recession • December 2007 – June 2009: • Duration: 18 months • Highest unemployment rate: 10% • Change in real GDP: - 5.1%
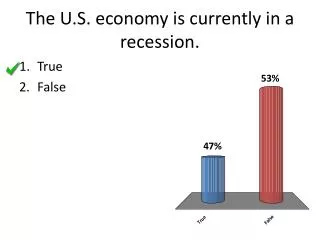
The Great Recession “By many measures, the financial crisis of 2007 to 2009 caused the deepest recession in the U.S. and world economies in more than 50 years. … while a repeat of the Depression was avoided, the “Great Recession,” as it is coming to be called, shook the U.S. and World economies in ways that almost no one thought was possible.” (Jones 2011)
Causes: Economic Growth Source: The World Bank, http://data.worldbank.org/data-catalog
Causes: Economic Growth Source: U.S. Department of Commerce, Bureau of Economics Analysis, http://www.bea.gov/national/index.htm#gdp
Causes: Economic Growth • Information Technology • New Growth Theory: Importance of Technology/ Innovative Ideas (Jones 2011) - • Paul Romer: objects and ideas. Objects include most economic goods. Ideas are instructions, designs for making objects, or recipes. • Properties of “ideas” – Non-rivalry and Increasing returns
Causes: Globalization Trade and Capital Flows
Causes: Globalization • The average worldwide tariff on manufacturing goods fell from about 14 percent in the early 1960s to 4 percent by 2000. (Jones 2011)
Causes: Globalization “The average cost of moving a ton a mile in 1890 was 18.5 cents (in 2001 dollars). Today, this cost is 2.3 cents. … Two factors have acted to decrease the importance of transportation costs for goods. First, the technologies designed for moving goods have improved. Second, the value of goods lies increasingly in quality, rather than quantity, so that we are shipping far fewer tons of goods relative to GDP than we have in the past.” (Glaeser and Kohlhase 2003)
Causes: Globalization • Trade and efficiency • Efficiency and economic growth
Causes: Globalization • Both imports and exports have risen from under 5 percent of GDP in the 1950s to as much as 17 or 12 per cent of GDP before the financial crisis. • Since 1975, the United States has experienced large trade deficits. Indeed, by 2006, the trade deficit had reached 5.7 percent of GDP.
Causes: Globalization Source: The World Bank, http://data.worldbank.org/data-catalog
Causes: Globalization • The United States is now a net debtor to the rest of the world. Net foreign debt reached nearly 25 percent of GDP in 2009.
Causes: Globalization The Global Saving Glut: “While developing countries on net borrowed $88 billion in 1996 from the rest of the world, by 2003 they were instead saving a net $205 billion into the world’s capital markets. … This demand for investments contributed to rising asset markets in the United States, including the stock market and the housing market.” (Jones 2011)
Causes: The US Interest Rates The U.S. FED Fund Rate - liquidity
Causes: The US Interest Rates Source: The Federal Reserve Bank, http://www.federalreserve.gov/monetarypolicy/openmarket.htm#2008
Causes: The US Interest Rate • In the period from 1980 to 2001, the Federal Funds rate had generally tracked economic conditions. After 2001 and until July 2004, however, the Fed kept interest rates low in spite of signs of growth in output and prices. Perhaps fearing a recession that did not materialize, the Federal Funds rate was set to only 1 percent from July 2003 to July 2004. (Rotemberg 2008).
The US Housing Market • Average house prices across the United States had risen steadily since 1975 and reached about 12 percent per annum in late 2005 and early 2006. (Rotemberg 2008).
The US Housing Market Source: Financial Crisis Inquiry Commission
The US Housing Market Source: Financial Crisis Inquiry Commission
The US Housing Market • Professor Chris Mayer of Columbia University: ”There is no natural law that says U.S. housing prices have to stop here. None.” (Rotemberg 2008).
The US Housing Market • ”Traditional” fixed 30-year mortgage • 2/28 mortgages
The US Housing Market • “Subprime” borrowers: loan applications did not meet existing standards – poor credit records or high existing debt-to-income ratios.
The US Housing Market • One obvious difference between “subprime” and “prime” loans was that the former had higher interest rates and fees: 29% of the home loans made in 2006 had high interest rates (Rotemberg 2008).
The US Housing Market Source: Financial Crisis Inquiry Commission
The US Housing Market • As long as housing prices increased, these mortgages were secure: the borrower rapidly accumulated equity in the house that could be taken out in a refinance, allowing the mortgage to be repaid. (Rotemberg 2008)
The US Housing Market • Between May 2004 and May 2006, the Fed raised its interest rate from 1.25 percent to 5.25 percent in part because of concerns over increases in inflation.
The US Housing Market • According to Bernanke, by August 2007, nearly 16% of subprime mortgages with adjustable rates were in default. The problem then spiraled, as low housing prices led to defaults, which, in a vicious cycle, lowered housing prices even more. (Jones 2011)
The US Housing Market Source: Financial Crisis Inquiry Commission
Subprime Meltdown Two questions: • Why was the shock of sub-prime mortgages in such a large scale? • How did the (U.S. housing sector) shock transmit to the U.S. financial sector and then other economies?
Causes: Financial Innovations • Securitization: Like a decadent buffet at an expensive hotel, securitization involves lumping together large numbers of individual financial instruments such as mortgages and then slicing and dicing them into different pieces that appeal to different types of investors. A hedge fund may take the riskiest piece in the hope of realizing a high return. A pension fund may take a relatively safe portion, constrained by the rules under which it operates. (Jones 2011)
Causes: Financial Innovations Source: Financial Crisis Inquiry Commission
Causes: Financial Innovations • According to a Lehman Brothers report, a substantial fraction of subordinate MBS (Mortgage-backed Securities) securities (those rated below AAA) were held by collateralized debt obligation (CDO) entities in 2007. It was common for CDOs to hold assets of other CDOs. CDOs were also heavily involved in markets for derivatives securities (CDS). (Rotemberg 2008)
Causes: Financial Innovations Source: Financial Crisis Inquiry Commission
Causes: Financial Innovations Source: Financial Crisis Inquiry Commission
Causes: Financial Innovations • Rating agencies generously applied favorable ratings to wide variety of assets. Since agencies profited at the issuance of an asset grade and were not paid based on the asset’s actual performance, the incentives of rating agencies were in question. Under criticism as well was their methodology for rating assets. One argument rating agencies, and also government regulators, was that they did not offer the compensation or prestige to attract top quality talent and so would always be a step behind financial innovation. (Segel and Creo 2010)
Causes: Financial Deregulation • 1996 - Federal Reserve reinterprets the Glass-Steagall Act several times, eventually allowing bank holding companies to earn up to 25 percent of their revenues in investment banking. • 1998, Citicorp-Travelers Merger – Citigroup, Inc. merges a commercial bank with an insurance company that owns an investment bank to form the world’s largest financial services company.
Causes: Financial Deregulation • 2000 - Commodity Futures Modernization Act – The bill prevented the Commodity Futures Trading Commission from regulating most over-the-counter derivative contracts, including credit default swaps.
Causes: Financial Deregulation • 2004 - Voluntary Regulation – The SEC proposes a system of voluntary regulation, allowing investment banks to hold less capital in reserve and increase leverage.
Subprime Meltdown • The investors who were holding these mortgage-backed securities often turned out to be the large commercial and investment banks themselves.
Subprime Meltdown • Liquidity crisis – a situation in which the volume of transactions in some financial markets falls sharply, making it difficult to value certain financial assets and thereby raising questions about the overall value of the firms holding those assets.
Subprime Meltdown • Another important feature of the financial crisis is that it was global in scope. In 2009, real GDP declined for the world as a whole, the first time this has happened in many decades.
Balance-sheet Crisis • A balance sheet consists of two columns. On the left are the assets of the institution – items of value that the institution owns. On the right are the liabilities – items of value that the institution owes to others.
A Hypothetical Bank’s Balance Sheet (billions of dollars) Source: Jones (2011)
Balance-sheet Crisis • Banks are subject to various financial regulations: • Reserve requirement mandates that banks keep a certain percentage of their deposits in a special account (“on reserve”) with the central bank. • Capital requirement mandates that the capital (net worth) of the bank be at least a certain fraction of the bank’s total assets.
Balance-sheet Crisis • Leverage is the ratio of total liabilities to net worth. • If the leverage ratio is 9, for every $10 of assets the bank holds, $9 is essentially financed by borrowing. Leverage magnifies both the gains and losses on investments. • Before the financial crisis, major investment banks had high leverage ratios. For example, when Bear Stearns collapsed, its leverage was 35 to 1. Roughly speaking, the major investment banks owned complex investment portfolios, including significant quantities of soon-to-be toxic assets, that were financed with $3 of their own equity and $97 of borrowing. Given this extraordinary leverage, major investment banks were in such a precarious position that a relatively small aggregate shock could send them over the insolvency edge. (Jones 2011)