Scalable Methods for Graph-Based Unsupervised and Semi-Supervised Learning
Scalable Methods for Graph-Based Unsupervised and Semi-Supervised Learning. Frank Lin PhD Thesis Oral ∙ July 24, 2012 Committee ∙ William W. Cohen ∙ Christos Faloutsos ∙ Tom Mitchell ∙ Xiaojin Zhu

Scalable Methods for Graph-Based Unsupervised and Semi-Supervised Learning
E N D
Presentation Transcript
Scalable Methods for Graph-Based Unsupervised and Semi-Supervised Learning Frank Lin PhD Thesis Oral ∙ July 24, 2012 Committee ∙ William W. Cohen ∙ Christos Faloutsos ∙ Tom Mitchell ∙Xiaojin Zhu Language Technologies Institute ∙School of Computer Science ∙Carnegie Mellon University
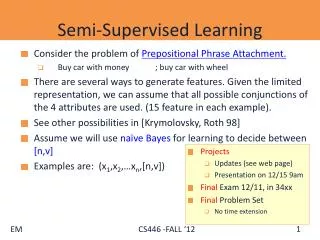
Motivation • Graph data is everywhere • We want to find interesting things from data • For non-graph data, it often makes sense to represent it as a graph • However, data can be big
Thesis Goal Make contributions toward fast, space-efficient, effective, simple graph-based learning methods that scale up.
MultiRankWalk – graph SSL, effective even with a few seeds Power iteration clustering – scalable alternative to spectral clustering methods Contributions A framework/technique for extending iterative graph learning methods to non-graph data ch2+3 PIC icml 2010 ch4+5 MRW asonam 2010 Important which instances are picked as seeds ch6 Implicit Manifolds MRW Document and noun phrase categorization via IM PIC document clustering via IM ch6.1 IM-PIC ecai 2010 ch6.2 IM-MRW mlg 2011 PIC mixed membership clustering via IM Graph SSL with Gaussian kernel via approximate IM ch7 MM-PIC in submission ch8 GK SSL in submission Clustering Classification
Talk Path ch2+3 PIC icml 2010 ch4+5 MRW asonam 2010 ch6 Implicit Manifolds ch6.1 IM-PIC ecai 2010 ch6.2 IM-MRW mlg 2011 ch7 MM-PIC in submission ch8 GK SSL in submission ch9 Future Work Clustering Classification
Talk Path ch2+3 PIC icml 2010 ch4+5 MRW asonam 2010 ch6 Implicit Manifolds ch6.1 IM-PIC ecai 2010 ch6.2 IM-MRW mlg 2011 ch7 MM-PIC in submission ch8 GK SSL in submission ch9 Future Work Clustering Classification
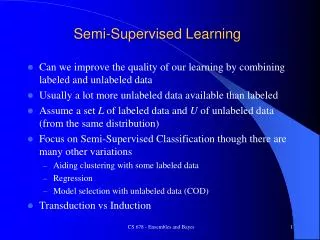
Power Iteration Clustering • Spectral clustering methods are nice, a natural choice for graph data • But they are expensive (slow) • Power iteration clustering (PIC) can provide a similar solution at a very low cost (fast)!
Background: Spectral Clustering Normalized Cut algorithm (Shi & Malik 2000): • Choose kand similarity function s • DeriveAfrom s, let W=I-D-1A, where Dis a diagonal matrix D(i,i)=Σj A(i,j) • Find eigenvectors and corresponding eigenvalues ofW • Pick the keigenvectors of Wwith the 2ndtokthsmallest corresponding eigenvalues • Project the data points onto the space spanned by these eigenvectors • Run k-means on the projected data points
Background: Spectral Clustering datasets 2 cluster 3 1 clustering space 2nd smallest eigenvector value index 3rd smallest eigenvector
Background: Spectral Clustering Can we find a similar low-dimensional embedding for clustering without eigenvectors? Finding eigenvectors and eigenvalues of a matrix is slow in general Normalized Cut algorithm (Shi & Malik 2000): • Choose kand similarity function s • DeriveAfrom s, let W=I-D-1A, where Dis a diagonal matrix D(i,i)=Σj A(i,j) • Find eigenvectors and corresponding eigenvalues ofW • Pick the keigenvectors of Wwith the 2ndtokthsmallest corresponding eigenvalues • Project the data points onto the space spanned by these eigenvectors • Run k-means on the projected data points There are more efficient approximation methods* Note: the eigenvectors of I-D-1A corresponding to the smallest eigenvalues are the eigenvectors of D-1A corresponding to the largest
The Power Iteration • The power iteration is a simple iterative method for finding the dominant eigenvector of a matrix: vt : the vector at iteration t; Typically converges quickly; fairly efficient if W is a sparse matrix v0 typically a random vector c : a normalizing constant to keep vt from getting too large or too small W : a square matrix
The Power Iteration • The power iteration is a simple iterative method for finding the dominant eigenvector of a matrix: i.e., a row-normalized affinity matrix What if we let W=D-1A (like Normalized Cut)?
The Power Iteration Begins with a random vector Overall absolute distance between points decreases, here we show relative distance Ends with a piece-wise constant vector!
Implication • We know: the 2nd to kth eigenvectors of W=D-1A are roughly piece-wise constant with respect to the underlying clusters, each separating a cluster from the rest of the data (Meila & Shi 2001) • Then: a linear combination of piece-wise constant vectors is also piece-wise constant!
Spectral Clustering datasets 2 cluster 3 1 clustering space 2nd smallest eigenvector value index 3rd smallest eigenvector
Linear Combination… a· + b· =
Power Iteration Clustering PIC results vt
Power Iteration Clustering Key idea: To do clustering, we may not need all the information in a full spectral embedding (e.g., distance between clusters in a k-dimension eigenspace) We just need the clusters to be separated in some space
At the beginning, v changes fast, “accelerating” to converge locally due to “noise terms” with small λ When to Stop The power iteration with its components: If we normalize: When “noise terms” have gone to zero, v changes slowly (“constant speed”) because only larger λterms (2…k) are left, where the eigenvalue ratios are close to 1 Because they are raised to the power t, the eigenvalue ratios determines how fast v converges to e1
Power Iteration Clustering • A basic power iteration clustering (PIC) algorithm: • Input: A row-normalized affinity matrix W and the number of clusters k • Output: Clusters C1, C2, …, Ck • Pick an initial vector v0 • Repeat • Set vt+1← Wvt • Set δt+1 ← |vt+1 – vt| • Increment t • Stop when |δt – δt-1| ≈ 0 • Use k-means to cluster points on vt and return clusters C1, C2, …, Ck
Evaluating Clustering for Network Datasets Each dataset is an undirected, weighted, connected graph Clusters are matched to classes using the Hungarian algorithm Every node is labeled by human to belong to one of k classes We use classification metrics such as accuracy, precision, recall, and F1 score; we also use clustering metrics such as purity and normalized mutual information (NMI) Clustering methods are only given k and the input graph
PIC Runtime Normalized Cut, faster eigencomputation Normalized Cut Ran out of memory (24GB)
PIC Accuracy on Network Datasets Upper triangle: PIC does better Lower triangle: NCut or NJW does better
Multi-Dimensional PIC • One robustness question for vanilla PIC as data size and complexity grow: • How many (noisy) clusters can you fit in one dimension without them “colliding”? Cluster signals cleanly separated A little too close for comfort?
Multi-Dimensional PIC • Solution: • Run PIC d times with different random starts and construct a d-dimension embedding • Unlikely any pair of clusters collide on all d dimensions
Multi-Dimensional PIC 1-D PIC embeddings lose on accuracy at higher k’scompared to NCut and NJW • Results on network classification datasets: RED: PIC using 1 random start vector GREEN: PIC using 1 degree start vector BLUE: PIC using 4 random start vectors (# of clusters) But using a 4 random vectors instead helps! Note # of vectors << k
PIC Related Work • Related clustering methods: PIC is the only one using a reduced dimensionality – a critical feature for graph data!
Talk Path ch2+3 PIC icml 2010 ch4+5 MRW asonam 2010 ch6 Implicit Manifolds ch6.1 IM-PIC ecai 2010 ch6.2 IM-MRW mlg 2011 ch7 MM-PIC in submission ch8 GK SSL in submission ch9 Future Work Clustering Classification
MultiRankWalk • Classification labels are expensive to obtain • Semi-supervised learning (SSL) learns from labeled and unlabeled data for classification • For network data, what is a efficient and effective method that requires very few labels? • Our result: MultiRankWalk! ☺
Random Walk with Restart • Imagine a network, and starting at a specific node, you follow the edges randomly. • But with some probability, you “jump” back to the starting node (restart!). If you recorded the number of times you land on each node, what would that distribution look like?
Random Walk with Restart What if we start at a different node? Start node
Random Walk with Restart What if we start at a different node?
Random Walk with Restart • The walk distribution r satisfies a simple equation: Start node(s) Transition matrix of the network Restart probability “Keep-going” probability (damping factor)
Random Walk with Restart • Random walk with restart (RWR) can be solved simply and efficiently with an iterative procedure:
MRW: RWR for Classification • Simple idea: use RWR for classification RWR with start nodes being labeled points in class A RWR with start nodes being labeled points in class B Nodes frequented more by RWR(A) belongs to class A, otherwise they belong to B
Evaluating SSL for Network Datasets Each dataset is an undirected, weighted, connected graph For every trial, all the non-seed instances are used as test data Every node is labeled by human to belong to one of k classes Evaluation metrics are accuracy, precision, recall, F1 score We vary the amount of labeled training seed instances
Network Datasets for SSL Evaluation • 5 network datasets • 3 political blog datasets • 2 paper citation datasets • Questions • How well can graph SSL methods do with very few seed instances? (1 or 2 per class) • How to pick seed instances?
MRW Results MRW does much better when only using a few seeds! Accuracy: MRW vs. harmonic functions method (HF) With lots of seeds, both methods do well Upper triangle: MRW better Lower triangle: HF better legend: + a few seeds × more seeds ○ lots of seeds
MRW: Seed Preference • Obtaining labels for data points is expensive • We want to minimize cost for obtaining labels • Observations: • Some labels more “useful” than others as seeds • Some labels easier to obtain than others Question: “Authoritative” or “popular” nodes in a network are typically easier to obtain labels for. But are these labels also more useful than others as seeds?
y-axis: (MRW F1) – (HF F1) MRW Results • Difference between MRW and HF using authoritative seed preference Random: MRW >> HF for low # seed x-axis: # seed labels per class Gap between MRW and HF narrows with authoritative seeds on most datasets PageRank seed preference works best!
Big Picture: Graph-based SSL • Graph-based semi-supervised learning methods can often be viewed as methods for propagating labels along edges of a graph. • Many of them can be viewed in relation to Markov random walks Labeled class A Label the rest via random walk propagation Labeled Class B
Two Families of Random Walk SSL Backward random walk (with Sink Nodes) Forward random walk (with restarts) • HF’s cousins: • Partially labeled classification using Markov random walks (Szummer & Jaakkola 2001) • Learning on diffusion maps (Lafon & Lee 2006) • The rendezvous algorithm (Azran 2007) • Weighted-voted relational network classifier (Macskassy & Provost 2007) • Adsorption (Baluja et al. 2008) • Weakly-supervised classification via random walks (Talukdar et al. 2008) • and many others… • MRW’s cousins: • Learning with local and global consistency [Variation 1] (Zhou et al. 2004) • Web content classification using link information (Gyongyi et al. 2006) • Graph-based SSL as a generative model (He et al. 2007) • and others …
Backward Random Walk w/ Sink Nodes If I start walking randomly from this node, what are the chances that I’ll arrive in A (and stay there), versus B? Sink node A Sink node B To compute, run random walk backwards from A and B No inherent regulation of probability mass, but can ameliorate with heuristics such as class mass normalization Related to hitting probabilities
Forward Random Walk w/ Restart Random walker A starts (and restarts) here What’s the probability of A being here at any point in time? How about B? Random walker B starts (and restarts) here To compute, run random walk forward, with restart, from A and B Inherent regulation of probability mass, but how to adjust it if we know a prior distribution? The probability of the walker at a this node, given infinite time
Talk Path ch2+3 PIC icml 2010 ch4+5 MRW asonam 2010 ch6 Implicit Manifolds ch6.1 IM-PIC ecai 2010 ch6.2 IM-MRW mlg 2011 ch7 MM-PIC in submission ch8 GK SSL in submission ch9 Future Work Clustering Classification
Implicit Manifolds • Graph learning methods such as PIC and MRW work well on graph data. • Can we use them on non-graph data? What about text documents?
The Problem with Text Data • Documents are often represented as feature vectors of words: The importance of a Web page is an inherently subjective matter, which depends on the readers… In this paper, we present Google, a prototype of a large-scale search engine which makes heavy use… You're not cool just because you have a lot of followers on twitter, get over yourself…
The Problem with Text Data • Feature vectors are often sparse • But similarity matrix is not! Mostly non-zero - any two documents are likely to have a word in common Mostly zeros - any document contains only a small fraction of the vocabulary
The Problem with Text Data • A similarity matrix is the input to many graph learning methods,such as spectral clustering, PIC, MRW, adsorption, etc. Too expensive! Does not scale up to big datasets! O(n2) time to construct O(n2) space to store > O(n2) time to operate on
The Problem with Text Data A lot of cool work has gone into how to do this… • Solutions: • Make the matrix sparse • Implicit Manifold But this is what we’ll talk about!