Download
1 / 24
240 likes | 404 Views
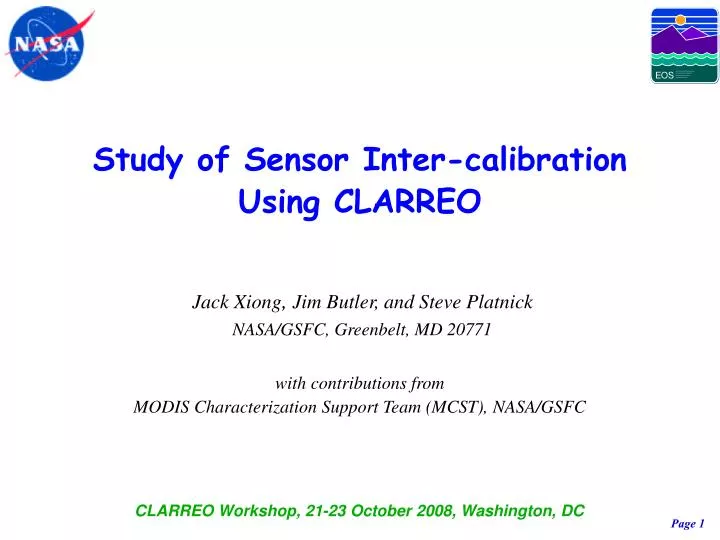
Study of Sensor Inter-calibration Using CLARREO Jack Xiong , Jim Butler, and Steve Platnick NASA/GSFC, Greenbelt, MD 20771 with contributions from MODIS Characterization Support Team (MCST), NASA/GSFC. CLARREO Workshop, 21-23 October 2008, Washington, DC. Page 1. Outline. Introduction

E N D
Study of Sensor Inter-calibrationUsing CLARREOJack Xiong, Jim Butler, and Steve PlatnickNASA/GSFC, Greenbelt, MD 20771with contributions fromMODIS Characterization Support Team (MCST), NASA/GSFC CLARREO Workshop, 21-23 October 2008, Washington, DC Page 1
Outline • Introduction • Applications of CLARREO • Requirements for CLARREO Observations • Inter-calibration Approaches Using CLARREO • Lunar observations • VIS/NIR/SWIR only • Simultaneous nadir observations (SNO) • Ground observations (Dome C) • Inter-comparison of Terra and Aqua MODIS calibration • Sensitivity Study (future work) • RSR sensitivity study (using Schiamachy with LaRC) • Spectral and spatial sensitivity studies of Earth view targets (Hyperion and AVIRIS) • Summary Page 2
Introduction • Applications of CLARREO • Benchmark Observations • Accurate, stable, SI traceable, spectrally resolved • Inter-calibration for Other Sensors • Consistent data records for long-term climate change • Requirements for CLARREO Observations • General Requirements • Spectral; spatial; temporal; orbital • Special Requirements • Maneuver (pointing) capability • Lunar observations Page 3
Inter-calibration Approaches Using CLARREO • Lunar observations • MODIS (T/A), SeaWiFS, Hyperion, VIRS/TRMM • Simultaneous nadir observations (SNO) • MODIS (T/A), AVHRR, AIRS, MISR, ASTR, Landsat, GLI, VIRS/TRMM • Ground observations • Dome Concordia, Antarctica • MODIS (T/A), AVHRR, AIRS, MISR, ASTR • Inter-calibration of Terra and Aqua MODIS Collaboration with USGS (Moon), NOAA, JPL, JAXA, USGC (SNO/Dome C) Page 4
Xiong and Sun (GRSL in press) Inter-calibration Using Lunar Observations Images form Aqua MODIS (band 1) Lunar Observations (Oct 04 – Jun 05) MODIS Lunar Observations: via spacecraft maneuvers at fixed phase angle reference to a lunar model (USGS) using integrated irradiance Advantages vs disadvantages: Page 5
Inter-calibration Using SNO Terra MODIS Aqua MODIS SNO SNO AVHRR For RSB For TEB Advantages vs disadvantages: Page 6
Inter-calibration Using a Ground Target • Why using a ground target • Validate on-board calibration; complement other cal/val approaches • Monitor calibration long-term stability • Support sensor inter-calibration • Requirements for a ground “calibration” target • Spectral and spatial uniformity and radiometric stability (minimum environmental impact) • Site accessibility and data availability • Ground measurements of radiometric traceability Aqua MODIS SD Degradation (0.41 to 0.94mm) Any Impact on Calibration? Page 7
Examples of Using Dome C for Inter-calibration • Site Description • Data Selection • Methodology • Thermal emissive: reference to Automated Weather Station (AWS) measurements • Solar reflective: BRDF model based on ground measurements over Antarctic snow • Results from MODIS • Recent presentation at SPIE Europe Remote Sensing (Xiong et al. 2008) • Future Work Page 8
Site Description • Located on Antarctic Plateau (75.1 S, 123.4 E) • One of the most homogeneous land surfaces on earth in terms of surface temperature and emissivity. • Uniformity over spatial scales typical of the ground footprint of satellite sensors • High altitude (~3200 m) & minimal slope • Low snow accumulation rate • Extremely dry, cold & rarefied atmosphere • Low fractional cloud coverage • Low atmospheric aerosol and water vapor content • Permanently manned Research Station now operational • AWS data available since 1995 • 10-minute averages of meteorological parameters (T, RH, WS, WD, P) • Daily radiosonde measurements • Frequent satellite overpass Dome Concordia Antarctica CEOS Endorsed Site NASA/NOAA/ESA Effort Page 9
Data Selection • MODIS Collection 5 Level 1B data • Multiple MODIS observations each day (~8) at different angles of incidence. • Only near-nadir overpasses used (nadir track within +/- 50 km of Dome C). One granule every 2-3 days. • 20x20 pixel average centered on Dome C • No cloud screening applied for TEB. All granules used. • Uniformity screening applied for RSB to eliminate any granules showing greater than 2% non-uniformity in reflectance over the 20x20 pixel area Page 10
Methodology and Approach (TEB) AWS surface temperature measurements are used as a proxy to track any trends in the relative bias between MODIS Terra & Aqua. DTMODIS = BTMODIS – TAWS Relative Bias = DTTerra – DTAqua Relative Bias calculated for each MODIS band and only for days with measurements from both Terra & Aqua. Applications to other sensors: relative spectral response (RSR), spatial resolution (ground footprint) Page 11
Methodology and Approach (RSB) A BRDF model developed by Warren et al. (JGR 1998) based on near-surface reflectance measurements over the Antarctic snow R (θ,ψ,φ) = c1 + c2cos(π- φ)+ c3cos[2(π- φ)] c1, c2 and c3are functions of cos(θ) and cos(ψ) c1 = a0 + a1[1 - cos(ψ)], c2 = a2[1 - cos(ψ)], c3 = a3[1 - cos(ψ)] ai = b0i + b1icos(θ) + b2icos2(θ) (i = 0, 1, and 2) where θ is the incident solar zenith angle, ψ is the viewing zenith angle, and φ is the relative azimuth angle. A ratio of the observed reflectance factor r to modeled reflectance factor R is calculated byΔr = r / R Spectral BRDF of Antarctic snow from Hudson, Warren et al (JGR 2006) Page 12
Terra: Black diamonds; Aqua: Blue squares Sensor (11 and 12 mm) and AWS Observations Good correlation between sensor and AWS observations (focusing long-term behavior, not individual observations) Page 13
DTMODIS = BTMODIS – TAWS 11mm 12mm Terra: Black diamonds; Aqua: Blue squares Long-term draft (<10mK) for bands 31 and 32; high quality on-board TEB calibration Relative Bias = DTTerra – DTAqua (time) Excellent calibration consistency (11mm: 0.025±2.984K; 12mm: 0.013±3.010K) Relative Bias = DTTerra – DTAqua (temperature) No obvious temperature dependent bias (<20mK) Page 14
Inter-comparison of Aqua MODIS and AIRS at 11 mm (using Dome C observations) Dome C data (near nadir) Old version New version One orbit – June 20, 2006 (near nadir footprints) 190K – 330K Page 15
Sensor (0.65 and 0.86 mm) Observations strong correlation between sensor observations and solar zenith angle Page 16
Sensor (0.65 and 0.86 mm) Observations versus Modeled Values Model parameters derived using sensor first-year observations Averaged fitting residual: 1.3 – 1.9% Page 17
Terra MODIS observations (0.65mm) over Dome C (2002 - 2003) Page 18
Terra MODIS observations (0.86mm) over Dome C (2002 - 2003) Page 19
Sensitivity Study (future work) • RSR Sensitivity Study • Extend from our previous study reported at April/May CLARREO workshop (e.g., preferred inter-calibration scene types vs. spectral band) • Work with LaRC using Schiamachy data • Spectral and Spatial Sensitivity Studies • Hyperion observations, Dome C and other targets • 0.4 to 2.5mm, 30m IFOV (@705km altitude) • AVIRIS observations • 0.4 to 2.5mm, 1 mrad IFOV Page 21
http://eo1.usgs.gov/hyperion.php Page 22
http://aviris.jpl.nasa.gov/html/aviris.instrument.html Page 23
Summary • Sensor Inter-calibration Using CLARREO • Improve current sensor inter-calibration approaches with highly accurate, stable, and spectrally resolved observations • Resolve calibration differences or establish calibration consistency among sensors with on-orbit SI traceable measurements • Ground Target Characterization Using CLARREO • Extend consistent data records, using observations from previous, current, and future missions/sensors, for studies of long-term climate changes • Dome C site can be used to track sensor long-term stability and calibration consistency among sensors (challenges in VIS/NIR/SWIW) • Other Approaches • Lunar observations; SNO Page 24