Breakeven Analysis: Understanding Supply and Demand Curves for Equilibrium Price Calculation
Learn how to calculate the breakeven point using fixed costs, variable costs, total revenue, and total cost in the context of supply and demand curves. Explore the intricacies of determining equilibrium price and quantity in economic analysis.

Breakeven Analysis: Understanding Supply and Demand Curves for Equilibrium Price Calculation
E N D
Presentation Transcript
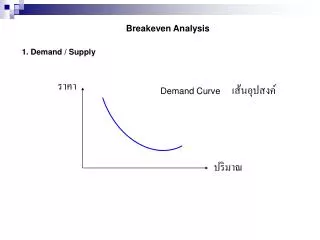
Breakeven Analysis 1. Demand / Supply ราคา Demand Curveเส้นอุปสงค์ ปริมาณ
SupplyCurve ราคา ปริมาณ
ราคา Equilibrium Price ปริมาณ
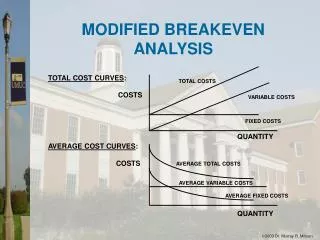
2. Fixed Cost Fixed Cost Building, Insurance. Equipment Capital Recovery Management Sorely Info. System. etc. Cost B number
3. Variable Cost Variable Cost Direct Labor, Direct Materials etc. ฿ number
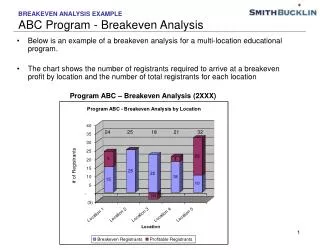
5. Break Even point TR Profit = Total Revenue – Total Cost = TR – TC O = TR – (FC + VC) at Break even point ฿ TC ni Break even point