Download
1 / 35
350 likes | 488 Views
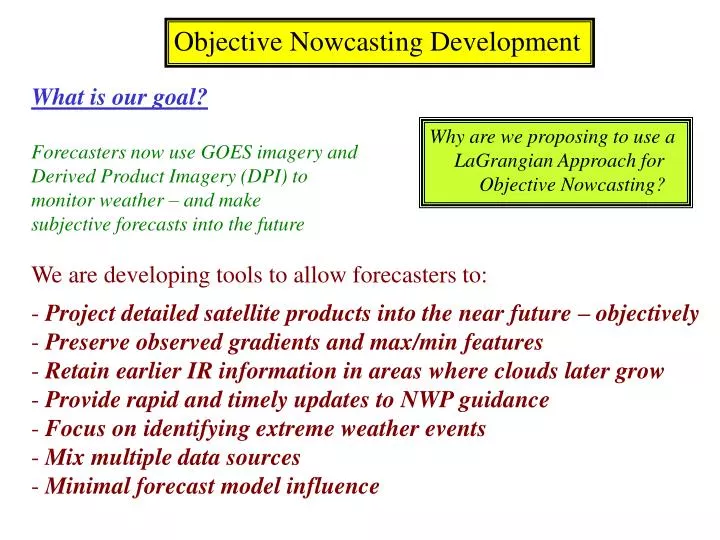
Objective Nowcasting Development. What is our goal? Forecasters now use GOES imagery and Derived Product Imagery (DPI) to monitor weather – and make subjective forecasts into the future We are developing tools to allow forecasters to:

E N D
Objective Nowcasting Development • What is our goal? • Forecasters now use GOES imagery and • Derived Product Imagery (DPI) to • monitor weather – and make • subjective forecasts into the future • We are developing tools to allow forecasters to: • - Project detailed satellite products into the near future – objectively • Preserve observed gradients and max/min features • Retain earlier IR information in areas where clouds later grow • Provide rapid and timely updates to NWP guidance • Focus on identifying extreme weather events • Mix multiple data sources • Minimal forecast model influence Why are we proposing to use a LaGrangian Approach for Objective Nowcasting?
Background: Nowcasting Task Description • A new objective nowcasting tool has been formulated which: • Preserves and takes full advantage of both: • Horizontal and vertical detail (discontinuities) inherent in future hyper-spectral satellite products and • Frequent information updates available from current and future geostationary instruments. • The technique: • must be fast (required due to the perishability of information regarding severe weather development), • preserves observed data to the fullest extent (retains data extremes) • integrates GOES data with data from other data sources in a timely and faithful manner. • can be used to update conventional NWP guidance • uses minimal computing resources, a necessity for forecast office application.
Task Progress this past year: • 1 - Formulate basis for LaGrangian Nowcasting approach • The conceptual and dynamical basis for the LaGrangian Nowcasting approach was documented and presented at the GOES Users’ Conference in May 2004. Preparation of a journal article continues. • 2 - Performed analytical accuracy and performance tests • Additional analytical tests of advantage of LaGrangian techniques to different dynamical processes especially relevant to nowcasting have been built emphasizing the Jet Streak. The goals are two-fold: • To provide evidence of the advantage of the LaGrangian approach in a manner relevant to forecasters and • To provide a tools for teaching: • A more thorough understanding of the dynamical processes involved in mesoscale systems – especially those related to creating an environment conducive to severe storm development – and • How the result of these dynamics is shown in rapidly changing GOES satellite data
3. Initial Nowcasting Model Prototype Developed Testing of the initial prototype LaGrangian nowcasting model updating system began last year and is continuing under the guidance of Bob Aune (NESDIS at CIMSS). The Initial LaGrangian Nowcasting model is being upgraded to use 10 km RUC grids as a basis. This change will allow: Better compatibility with full resolution GOES DPIs Higher resolution initial winds Integration of other data sources. Results are being produced in “DPI look alike formats” Daily results will be posted on a web page.
Case of convection on 20 July 2005 which was initially moved over Central Wisconsin, Decayed and then Redeveloping past Chicago 1545 UTC 1715 UTC 1915 UTC Why did initial convection decay and why did it reform where it did?
0700 UTC Lower-tropospheric GOES Sounder Derived Product Imagery (DPI) 3 layers of Precipitable Water Sfc-900 hPa 900-700 hPa 700-300 hPa 1000 UTC Moisture Maximum 1300 UTC However, after initial storm has developed, cirrus blow-off masks lower-level moisture maximum in subsequent IR satellite observations Small cumulus developing in boundary layer later in morning also mask retrievals in second area. 1800 UTC GOES 900-700 hPa Precipitable Water - 20 July 2005
0700 UTC Mid-tropospheric GOES Sounder Derived Product Imagery (DPI) 3 layers of Precipitable Water Sfc-900 hPa 900-700 hPa 700-300 hPa 1000 UTC Maximum Dryness 1300 UTC Over time, cirrus blow-off also masks the presence of an extended area of mid-level dryness. (Differential motion of lower-tropospheric moisture under upper-tropospheric dryness creates convective instability) 1800 UTC GOES 700-300 hPa Precipitable Water - 20 July 2005
Returning to 20 July 2005 case Question: Can GOES Sounder Derived Product Imagery (DPI) be projected forward in time to provide forecasters more information about second storm development south of Chicago at ~ 1800 UTC? 0700 UTC 1000 UTC Moisture Maximum 1300 UTC However, after initial storm has developed, cirrus blow-off masks lower-level moisture maximum in subsequent IR satellite observations Small cumulus developing in boundary layer also mask retrievals in second moist area. 1800 UTC GOES 900-700 hPa Precipitable Water - 20 July 2005
White =Cloudy Blue = Moisture Maximum 20 July 2005 Case StudyNowcasting the Lower-Tropospheric Moisture Source1200 UTC data projected forward to 1800 UTC 0.00 Hr LaGrangian Nowcast 900-700 GOES Precipitable Water 0-10 mm – Red,10-20 mm – Green>20 mm - Blue
0.00 Hr LaGrangian Nowcast 900-700 GOES Precipitable Water 0-10 mm – Red,10-20 mm – Green>20 mm - Blue
0.50 Hr LaGrangian Nowcast 900-700 GOES Precipitable Water 0-10 mm – Red,10-20 mm – Green>20 mm - Blue
1.00 Hr LaGrangian Nowcast 900-700 GOES Precipitable Water 0-10 mm – Red,10-20 mm – Green>20 mm - Blue
1.50 Hr LaGrangian Nowcast 900-700 GOES Precipitable Water 0-10 mm – Red,10-20 mm – Green>20 mm - Blue
2.00 Hr LaGrangian Nowcast 900-700 GOES Precipitable Water 0-10 mm – Red,10-20 mm – Green>20 mm - Blue
2.50 Hr LaGrangian Nowcast 900-700 GOES Precipitable Water 0-10 mm – Red,10-20 mm – Green>20 mm - Blue
3.00 Hr LaGrangian Nowcast 900-700 GOES Precipitable Water 0-10 mm – Red,10-20 mm – Green>20 mm - Blue
3.50 Hr LaGrangian Nowcast 900-700 GOES Precipitable Water 0-10 mm – Red,10-20 mm – Green>20 mm - Blue
4.00 Hr LaGrangian Nowcast 900-700 GOES Precipitable Water 0-10 mm – Red,10-20 mm – Green>20 mm - Blue
4.50 Hr LaGrangian Nowcast 900-700 GOES Precipitable Water 0-10 mm – Red,10-20 mm – Green>20 mm - Blue
5.00 Hr LaGrangian Nowcast 900-700 GOES Precipitable Water 0-10 mm – Red,10-20 mm – Green>20 mm - Blue
5.50 Hr LaGrangian Nowcast 900-700 GOES Precipitable Water 0-10 mm – Red,10-20 mm – Green>20 mm - Blue
6.00 Hr LaGrangian Nowcast 900-700 GOES Precipitable Water 0-10 mm – Red,10-20 mm – Green>20 mm - Blue
Important Lower-Level Moisture Information about Storm Formation Obscured by Clouds from Storm in Observations 6.00 Hr LaGrangian Nowcast 900-700 GOES Precipitable Water 0-10 mm – Red,10-20 mm – Green>20 mm - Blue
4. Initial testing Initial tests of the previous prototype system were discontinued during at mid-year in order to concentrate on the development of the new model. Once the new model passes checkout, the tests will continue. The objective of these tests is to provide forecasters continuous updates of 3 to 6 hour forecasts of the DPI fields. Initial tests are focusing on the ability of the technique to preserve observed gradients without developing biases.
5. Visualization Visualization tools must be incorporated to allow forecasts to see the predicted DPIs in formats identical to the current observational products. There must be no impediments to implementation of the newest GOES forward models with the new nowcasting model. Postprocessing procedures have been tested and are in place for converting the new nowcasting model outputs into synthetic forecast DPIs. We have also responded positively to requests from EMC to assist in their efforts to develop ‘satellite like’ images of clouds and other variables from NCEP’s operational mesoscale models (WRF).
GOES-12 single field-of-view Level 2 precipitable water (mm) valid at 15, 16, 17 and 18 UTC, August 18, 2005
GOES-12 single field-of-view Level 2 precipitable water (mm) valid at August 18, 2005 at 15, 16, 17 and 18 UTC, advanced forward to 18 UTC
6. Incorporation of other data sources • Aircraft, Wind Profiler and cloud tracked wind data will be integrated • to provide observed wind as well as moisture data updates. • Offline test of the LaGrangian approach using observed Wind Profiler data • [and in the near future AERI data (used to emulate GOES-R) and current GOES data] • have begun using data from the May 1999 Oklahoma City tornado case. • The sample shown next illustrates how parcels (initialized at any location • and any level) can be projected forward in time to identify: • Air Parcel Source Regions • Projected paths • Future development of Divergence/Convergence • Multiple level combinations • Development of Convective Instabilities • CAPE / CINH
Last Year we showed a Sample of a LaGrangian Diagnostic Study of The development of a Pre-Convective Environment using 3-hourly Analyses of Radiosonde Data From the SESAME Literature From Kocin et al., 1986. 218o 17.2 237o 16.7 255o 12.4 262o This rapid localized development Low-level Convergence was coincident with drying and Growth of Divergence in the Exit of the Jet Streak Aloft DIV=(-1294/1624)/7200 = -1.1x10⁻⁴ s-1 With the LaGrangian approach, d/dt (ξ + f) = - (ξ + f) DIVergence or DIV = - d/dt (ξ + f) / (ξ + f) (6/57)/3600=2.92x10-5+8x10-5=1.092x10-4 (7/57)/3600=3.41x10-5+8x10-5=1.241x10-4 (18/57)/3600=8.77x10-5+8x10-5=1.677x10-4 (19/57)/3600=9.26x10-5+8x10-5=1.726x10-4 Change in Vorticity at 1900 GMT yields 1.04x10⁻⁴ CONVERGENCE 262o 10.9 268o Vorticity x 10-5 s -1
An example from this years efforts uses trajectory procedure in both a Forward (forecast) and Backward (diagnosis) mode. • Wind Profiler data take at 2100UTC (shortly prior to the first severe thunderstorm development) are both traced backward (to trace the origins of the air parcels) and forward (to project their future paths and indicate potential divergence) for 3 hours. • Note: • 1- the increase in convergence between 2100 and 0000 UTC and • 2- the increased cyclonic curvature during the period of storm development, an area which 3 hours earlier had show divergence. • These results are consistent with diagnostic calculation of divergence and moisture flux divergence made using the Wind Profile and AERI data reported previously.
7. Incorporate existing hyper-spectral Products AIRS soundings will be used to begin assessing the impact of higher vertical resolution on resolving the pre-convective environment. Task under development. These data are available now for testing. 8. Development of supporting algorithms The process of recombining the ‘forecast parcels’ onto a regular grid for visualization will ultimately require improvements in ‘aging algorithms’ used to combine the influence of recent and past forecast parcels based on expected forecast confidence and data density. Activity in this area is planned for early 2006.
9. Data Level Matching The level of the atmosphere which is represented in GOES water vapor products varies as a function of the atmospheric water vapor content itself, As such, techniques are needed to assure that the winds and geopotential fields used to translate air parcels are representative of the level of the maximum weighting function for each piece of moisture information. This, for example, will prevent ‘upper level dry slots’ from being moved with winds from too high in the atmosphere – since the peak of the weighting function for these features is lower in the atmosphere than in most ‘moist’ cases
10. Product Testing and Evaluation • Thorough and systematic testing of the next generation of nowcasting products is • essential to for the successful introduction and use of these new products. • Much of this responsibility will be placed on the new graduate student who will be joining the project in the coming fall. • Evaluations will be done based on the full sets of observed data available at CIMSS, include comparisons with: • -observed satellite products, • -vertical profiles from rawinsondes and aircraft, • -wind profilers, • -surface observations, and • -model analyses and short-range forecasts. • The objective is: • -to assess major sources of error in the models and • -to validate the hypothesis that short-range projections of data provide improvements on already available longer-range NWP products
11. User Interactions and Involvement • Relationships will be established with several WFOs, NSSL and NCEP/SPC to serve • as focal points for evaluating and critiquing the new objective nowcasting products. • Initial data availability will be via web pages. • Overview seminars and training visits will be made to assess the optimal means • of accessing and using these new forecasting tools • - Will include several WFOs and Norman, OK • A goal will be to integrate additional nowcasting technique assessment • into the annual NSSL Spring Storm Experiment in 2006.
12. Operational Integration Discussion will begin with FSL as to the best approaches to consider for integrating the objective nowcasting tools into the AWIPS environment. Although the actual integration wouldn’t be expected for several years, early planning is essential. Likewise, COMET will be briefed on the benefits of the approach so that training programs can be developed as needed.