Download
1 / 64
640 likes | 719 Views
Dive deep into the fundamentals of atomic theory using electromagnetic radiation characteristics, atomic models by Planck, Einstein, Bohr, and more. Explore quantum numbers and states, electron configurations, and the formation of ionic bonds. Understand the principles behind the interactions and properties of atoms and molecules.

E N D
Electronic Structures of Atoms / Periodic Trends / Ionic Bonding / Solids / Phase Changes H Advanced Chemistry Unit 3
Objectives #1-3 Atomic Theory *review of electromagnetic radiation characteristics: (diagrams)
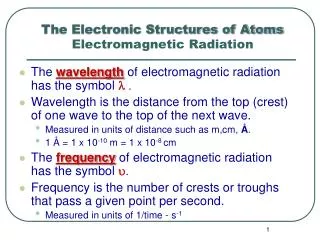
Objectives #1-3 Atomic Theory frequency, wavelength, energy frequency vs. wavelength (inverse relationship) frequency vs. energy (direct relationship) wavelength vs. energy (inverse relationship) c=fλ(c = speed of light in m/s, f = frequency in Hz (1/s), λ = wavelength in m)
Objectives #1-3 Atomic Theory E = hf or hc/λ h = Planck’s Constant (energy for waves)
Objectives #1-3 Atomic Theory E = mc2 (energy for particles) *Wave particle-duality Matter has wave and particle characteristics; acts as particle when interacting with matter; acts as wave when travelling through space
Derivation of de Broglie’s Equation: Ewaves = Eparticles (examples)
Objectives #1-3 Atomic Theory *Work Function (Photoelectric Effect) Φ = hfo Φ = work function minimum energy required to remove electron from surface of metal fo = threshold frequency minimum frequency required to remove electrons from surface of metal (examples)
Objectives #1-3 Atomic Theory *Bohr’s Equation: E = -2.178 X 10⁻¹⁸ J (z2/n2) OR ∆E = -2.178 X 10⁻¹⁸ J (z2) X (1/n2final – 1/n2initial) used for: determining energy changes when electrons change energy levels for hydrogen; z = 1 (examples)
Objectives #1-3 Atomic Theory *Rydberg Equation: 1/λ = 1/91 nm (1/nL2 – 1/nH2) *used for: determining wavelength of photons released change energy levels (Examples) *relationships of answers: the greater the energy difference, the smaller the wavelength
Objectives #4-5 The Quantum Numbers and Quantum States *Review of Quantum Theory: • Quantum Numbers • Principle (n) *energy level of shell of electron *n = 1,2,3….. *(old system) n = K, L, M, …. *indicates the number of sublevels in energy level
Objectives #4-5 The Quantum Numbers and Quantum States • Orbital (l) *indicates orbital shape *l = 0, n-1 *s, p, d, f
Objectives #4-5 The Quantum Numbers and Quantum States • Magnetic (ml) *indicates orientation of orbital in space *ml = 0, +/-1 1 *the number of ml values indicate the number of orbitals within sublevel
Objectives #4-5 The Quantum Numbers and Quantum States • Spin (ms) *indicates spin of electron *+1/2 or -1/2 *allows for up to 2 electrons per orbital *s 2 electrons p 6 electrons d 10 electrons f 14 electrons
Objectives #4-5 The Quantum Numbers and Quantum States *Quantum Number Sets for Electrons in Atoms:
Objectives #4-5 The Quantum Numbers and Quantum States (examples of quantum number states problems)
Objectives #7-9 Electron Configurations of Ions / Orbital Filling and Periodic Trends *valence electrons and occasionally the electrons contained within the d sublevel are involved in chemical bonding *atoms tend to lose or gain electrons in such a way to complete octets (s2p6) or to from similarly stable arrangements called pseudo noble-gas configurations (examples) *Orbital Filling and Periodic Trends • Ionization Energy Group 1 Group 2 Group 15 Group 17 Group 18
Objective #10-12 Formation of the Ionic Bond / Born-Haber Cycle and Lattice Energy *ionic bonds involve the transfer of valence electrons from a metal to a nonmetal *the tendency for a metal to lose electrons depends on its ionization energy and the tendency of a nonmetal to gain electrons depends on its electron affinity *the loss of an electron requires a gain of energy and is therefore an endothermic process example: Na + energy › Na+1 + e- *the gain of an electron releases energy and is therefore an exothermic process example: Cl + e- › Cl-1 + energy
Objective #10-12 Formation of the Ionic Bond / Born-Haber Cycle and Lattice Energy *combinations of elements with low ionization energies and high electron affinities will cause an extremely exothermic reaction and generally be the most stable *example: Na(s) + Cl2(g) › NaCl(s) + energy *the energy produced when the ionic bond forms is referred to as the lattice energy; this energy is also equal to the energy required to break apart the ionic bond *chemical bonding not only involves a rearrangement of electrons but it also involves changes in energy
Objective #10-12 Formation of the Ionic Bond / Born-Haber Cycle and Lattice Energy *the formation of an ionic compound; such as the following reaction: Na(s) + 1/2Cl(2)(g) › NaCl(s) + ∆Hof= -410.9 kJ where ∆Hof refers to the standard heat of formation which is the energy change involved when a compound is formed from its elements, involves a series of energy changing steps known as the Born-Haber cycle *these steps are as follows:
Objective #10-12 Formation of the Ionic Bond / Born-Haber Cycle and Lattice Energy • Sublimation or Vaporization of nongaseous reaction components: Here: Na(s) › Na(g) 108 kJ which represents the energy of sublimation or vaporization (an endothermic process) • Breaking the bonds of any gaseous components: Here 1/2Cl2(g) › Cl(g)122 kJ which represents the dissociation energy (an endothermic process) (now that all reactants are gaseous, ions must be formed)
Objective #10-12 Formation of the Ionic Bond / Born-Haber Cycle and Lattice Energy • Formation of the positive ion: Here: Na(g) › Na+1(g) + e-496 kJ which represents the ionization energy (an endothermic process) • Formation of the negative ion: Here: Cl(g) + e- › Cl(g)-1-349 kJ which represents the electron affinity affinity(an exothermic process) • Formation of the ionic compound by combining the two ions formed together: Here: Na+1(g) + Cl(g)-1 › NaCl(s)-788 kJ which represents the lattice energy (an exothermic process) *the overall energy change, ∆Hof, is equal to the sum of all these changes: ∆Hof = ∆HofNa + ∆HofCl + IENa -EACl - ∆Hlattice
Objective #10-12 Formation of the Ionic Bond / Born-Haber Cycle and Lattice Energy *Relationship of lattice energy and ionic charge Consider the following lattice energy data from the above example problems: NaCl 788 kJ LiF 1030 kJ MgCl2 2326 kJ KCl 701 kJ **strength of ionic bonds: KCl ‹ NaCl ‹ LiF ‹ MgCl2 **size of ions: LiF ‹ MgCl2 ‹ NaCl ‹ KCl **charge of ions: Na +1, Cl -1 Li +1, F -1 K +1, Cl -1 Mg +2, Cl-1
Objective #10-12 Formation of the Ionic Bond / Born-Haber Cycle and Lattice Energy **formula: Eel. = KQ1Q2/d where “K” is a constant of electrical charge, where “Q1” and “Q2” are the charges of the ions involved, where “d” distance separating the ions As the magnitude of the charges in an ionic compound increases, the lattice energy increases (affects lattice energy the most) As the size of the ions involved decrease, the lattice energy increases (examples)
Objectives #13-14 Phase Changes and Phase Diagrams *Important Parts of a Heating/Cooling Curve (see curve in lecture guide) A. Specific heat of solid added (endothermic) B. Specific heat of liquid added (endothermic) • Specific heat of gas added (exothermic) • Melting (heat of fusion added) (endothermic) • Freezing (heat of solidification released) (exothermic) • Boiling (heat of vaporization added) (endothermic) G. Condensing (heat of condensation released) (exothermic)
Objectives #13-14 Phase Changes and Phase Diagrams *where the graph is increasing or decreasing, specific heat is being added or subtracted (which results in the temperature changing) *where the graph is not changing, a phase change is occurring and these is no change in the temperature of the substance *key equations: to change temperature: Q =mc∆t to change phase: ∆H = moles of material X molar heat of phase change (examples)
Objectives #13-14 Phase Changes and Phase Diagrams *Interpreting Phase Diagrams *a phase diagram allows one to determine the phase that a substance is in at a given temperature and pressure *the phase diagram only shows one substance in its various phases *a typical phase diagram: (see diagram in lecture guide) *the boundaries between different phase regions represent areas of equilibrium in which the two phase changes are occurring at the same rate; for example at the liquid – gas boundary, molecules of gaseous vapor are moving into the liquid phase while molecules of liquid are moving into the gaseous phase *if a point on the diagram does not fall on any line, only one phase is present
Objectives #13-14 Phase Changes and Phase Diagrams *the following lines on the graph represent phase change boundaries:
Objectives #13-14 Phase Changes and Phase Diagrams *some general relationships and observations to note: *if the solid-liquid line curves to the right with increasing pressure, then the melting point is also increasing (this is the norm) *if the solid-liquid line curves to the left with increasing pressure, then the melting point is decreasing (this is not the norm; water follows this pattern)
Objectives #15-17 Structure of Solids, Properties and Applications *solids come in two general types: crystalline or amorphous *crystalline solids contain particles arranged in a well-defined pattern called a crystal lattice with flat faces and definite angles; examples include NaCl or diamonds *amorphous solids lack any well defined structure; examples include wax, rubber, or glass *the crystal lattice of a crystalline solid, which is a three dimensional array showing the location of individual particles, is actually made up of many repeating individual parts called the unit cell; for example the repeating pattern on wall paper *the simplest common type of unit cell is the cubic unit cell where all sides are equal in length and consist of all 90oangles