U.S. Integrated Ocean Observing System (IOOS ® )
230 likes | 378 Views
A tool that enables the Nation to track, predict, manage and adapt to changes in our marine environment and delivers critical information to decision makers to…. U.S. Integrated Ocean Observing System (IOOS ® ). Improve safety. Enhance our economy. Protect our environment.

U.S. Integrated Ocean Observing System (IOOS ® )
E N D
Presentation Transcript
A tool that enables the Nation to track, predict, manage and adapt to changes in our marine environment and delivers critical information to decision makers to… U.S. Integrated Ocean Observing System (IOOS®) Improve safety Enhance our economy Protect our environment Hendrik L. Tolman on behalf of the US IOOS Program Office GODAE OceanView Meeting – November 14-18, 2011
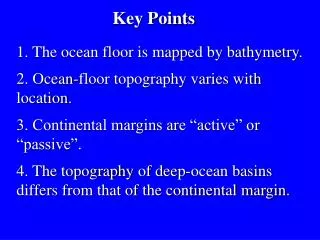
U.S. IOOS: Program Overview Global Component Coastal Component (EEZ to the head of tide) 12 • 7 Goals, 1 System • Improve predictions of climate changeand weather • Improve the safety and efficiency of maritime operations • Improve forecasts of natural hazards • Improve homeland security • Minimize public health risks • Protect and restore healthy coastal ecosystems • Sustain living marine resources Enhances science and improves decision making
Global Component: Global Ocean Observing System for Climate Total in situ networks 61% 87% 100% 59% 81% 100% 62% 73% 48% 34%
Coastal Component • Comprised of federal agencies (National level) and non-federal (Regional level) • Geographic extent: EEZ to the head of the tide • Supports multiple societal benefits; 7 goals; 1 System • Based on 26 variables • Data Management and Communications (DMAC) is a major focus that is intended to be enterprise wide from National to Regional scales
Examples of National Observing Networks • Stakeholders • > 30 institutions operate HF Radars; represents a Federal/State investment of $55M in last 15 years • Used by >40 government/private entities • Partnership with Industry: US-based CODAR Ocean Sensor • Who Depends on it • USCG Search and Rescue: Oil spill response • Water quality; Criminal forensics • Commercial marine navigation • Offshore energy; Harmful algal blooms • Marine fisheries • Emerging - Maritime Domain Awareness • Emerging – Tsunami Decreases search area by 66% in 96 hours
Data Integration - Community NANOOS is a community of people that provides data through one place for quicker decision-making. The value of NANOOS 1 • Washington Dept of Ecology • Oceanic Remote Chemical-optical Analyzer (ORCA) • USGS • University of Washington – Applied Physics Lab • NOAA National Data Buoy Center • King County • NOAA National Ocean Service • IntelliCheckMobilisa • Hood Canal Dissolved Oxygen Program 2 3 2 4 8 9 5 6 7 1 6 2 6 6 2 6 7 3 3 4 7 1 3
Data Integration – Regional to National U.S. National Data Buoy Center
U.S. IOOS®: Modeling Testbed • 5 teams, 64 scientists/analysts • SURA is overall lead for execution • Began in June 2010; now in the second year • Multi-sector engagement (federal agency, academia, industry) • Goals: • Less about model than process • Focus is on stable infrastructure (testing environment, tools, standard obs) and transition to operations • Enable Modeling and Analysis subsystem Coastal Inundation Gulf & Atlantic Coast Rick Leuttich, UNC-CH Shelf Hypoxia Gulf of Mexico John Harding, USM Estuarine Hypoxia Chesapeake Bay Carl Friedrichs, VIMS Cyber Infrastructure Eoin Howlett, ASA Testbed Advisory Evaluation Group Rich Signell, USGS
Surge, Waves and Inundation Team Results • Development of common Testbed infrastructure • Data Archiving • Model development/ Enhancement • HPC Time • Skill Analysis Gulf of Maine / Scituate Harbor - Extratropical Domain
Shelf Hypoxia Team Results • Improving Collaboration • Improving Data • Model Development • Supporting Operations NOAA CSDL planned coastal physical model implementations (nGOM shelf domain above currently planned for 2nd Qtr FY 12 initial NGOFS coastal ocean forecast operational capability)
Estuarine Hypoxia Results • Transitioning information to federal agencies • Model Comparison • Conducting sensitivity experiments • New, single term hypoxia model Five Hydrodynamic Models Configured for the Chesapeake Bay CH3D Cerco & Wang USACE EFDC Shen VIMS UMCES-ROMS Li & Li UMCES ChesROMS Long & Hood UMCES CBOFS (ROMS) Lanerolle & Xu NOAA
Cyber Infrastructure Team Results • Interactive Web Site: browse model results, view model grid data, side by side comparisons, and MUCH MORE • Unstructured Grid Support: Time series extraction completed for FVCOM, SELFE, ELCIRC, ADCIRC. • Matlab Toolbox: standardized data transformations, new methods for comparing data (including unit conversion). Coordination with OOI-CI • Matlab as a Web Service: Matlab processes - no desktop license required. • Skill Assessment Tools: Measure the degree of correlation between model prediction and observations • Collaborative Web Site: public/private access to portal, content organization with internal/external tools.
Responding to Crisis: Deepwater Horizon • U.S. IOOS partnership demonstrated ability to: • Quickly deploy technologies: Gliders and HF radar, saving resources/improving safety • Models/Imagery ingested into NOAA/Navy models • Data assimilation improved spill response decision-making and public understanding USM HFR TS Bonnie USF HFR HFR data informed NOAA trajectory forecasts HFR validation of SABGOM Forecast with satellite detected oil slicks Web Portal Briefing Blog
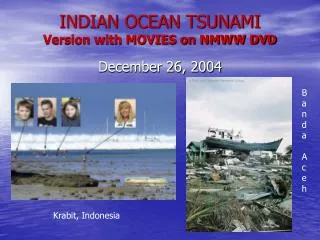
The peak tsunami wave at DART Station 21418 located 470n mi northeast of Tokyo. At 1.8m, this is the largest peak wave recorded by DART. Deep-ocean Assessment and Reporting of Tsunamis (DART) Buoys Graphic courtesy NOAA / PMEL / Center for Tsunami Research
Responding to Crisis: Japan Tsunami Response • CeNCOOS: • Recorded the tsunami passage with U.S. IOOS sensors • Five-fold increase in web traffic • NANOOS: • Featured “Tsunami Evacuation Zones for the Oregon Coast” application • NANOOS Visualization System provided easy access to current and water height data • Four-fold increase in web traffic • PacIOOS: • Provided the only real-time water level and turbidity measurements for Waikiki • Ten-fold increase in web traffic
NANOOS and the use of Social Media NANOOS joined Facebook in April 2010 to augment our traditional outreach methods. For the tsunami event, we provided information via Facebook in three groupings: a) Initial info including link to tsunami portal; b) graphs of water level for various locations; c) synthesis information Visits to the NANOOS Facebook page showed heightened interest about the tsunami. Yellow stars indicate posts by staff to the NANOOS FB page, and the red star indicates the day of the tsunami. www.facebook.com/NANOOS.PNW
Selected Products: Marine & Coastal NWS portal based on IOOS Regional Project Reducing Distress Calls Harmful Algal Bloom
Selected Products: Climate Variability & Change Ocean Acidification Partnership with shellfish growers Observations: Single system; multiple uses - NOAA PMEL working with RAs to deploy CO2 sensors % of living coral Puerto Rico Validating Sensors Integrated Coral Reef Monitoring
Selected Products: Ecosystems, Fisheries & Water Quality Gliders: Dissolved Oxygen water quality monitoring
U.S. IOOS® : A National Endeavor but in a Global Context • Comprehensive system • Data Integration critical • Sustaining the enterprise requires engagement by all