Download
1 / 79
790 likes | 810 Views
Internet QoS the underlying economics. Bob Briscoe Chief Researcher, BT Group Sep 2008. executive summary congestion accountability – the missing link. unwise NGN obsession with per-session QoS guarantees scant attention to competition from 'cloud QoS'

E N D
Internet QoSthe underlying economics Bob Briscoe Chief Researcher, BT Group Sep 2008
executive summarycongestion accountability – the missing link • unwise NGN obsession with per-session QoS guarantees • scant attention to competition from 'cloud QoS' • rising general QoS expectation from the public Internet • cost-shifting between end-customers (including service providers) • questionable economic sustainability • 'cloud' resource accountability is possible • principled way to heal the above ills • requires shift in economic thinking – from volume to congestion volume • provides differentiated cloud QoS without further mechanism • also the basis for a far simpler per-session QoS mechanism • having fixed the competitive environment to make per-session QoS viable
QoS: value ¹ cost • definition of 'premium' • services requiring better than normal QoS • not necessarily using network QoS mechanisms (e.g. VoIP) Sources: Analysys Research (2005) and S Rudkin, BT internal report (Oct 2005)
remember... competition • drives revenue towards cost • eventually ensures customers get the surplus value • not providers total customer value customersurplus providerrevenue providerprofit provider cost timeassuming network market growth
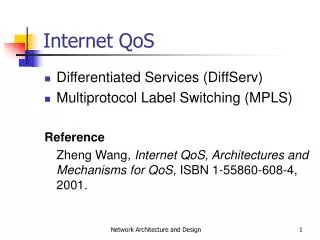
Internet QoSfirst, fix cost-based accountability Bob Briscoe
capacity costs C 1 B bandwidth cost, C £/bps • selling QoS = managing risk of congestion • if no risk of congestion, can’t sell QoS • congestion risk highest in access nets (cost economics of fan-out) • also small risk in cores/backbones (failures, anomalous demand) 0 0 aggregate pipe bandwidth, B /bps NB NA R1 ND S1
flow2 flow1 unresponsive flow3 how Internet sharing ‘works’endemic congestion& voluntary restraint • aka. those who take most, get most • technical consensus until Nov ‘06 was [Briscoe07]voluntarily polite algorithm in endpoints – ‘TCP-fairness’: • a game of chicken – taking all and holding your ground pays • or starting more ‘TCP-fair’ flows than anyone else (Web: x2, p2p: x5-100) • or for much much longer than anyone else (p2p file-sharing x200) • net effect of both (p2p: x1,000-20,000 higher traffic intensity) [Briscoe08] capacity bandwidth2 bandwidth1 time (VoIP, VoD Joost 700kbps)
TCP's broken resource sharingbase example: different activity factors rate time flowactivity 2Mbps access each 80 users ofattended apps 20 users of unattended apps 10Mbps
80 users of attended apps 20 users of unattended apps 2Mbps access each TCP's broken resource sharingcompounding activity factor & multiple flows rate time flowactivity 10Mbps
number of TCP connections Web1.1: 2 BitTorrent: 5-100 observed active varies widely depending on no. of torrents per user maturity of swarm config’d parameters details suppressed: utilisation never 100% but near enough during peak period on DSL, upstream constrains most p2p apps other access (fixed & wireless) more symmetric realistic numbers?there are elephants in the room
105-114 active TCP connections altogether 1 of 3 torrents shown ~45 TCPs per torrent but ~40/torrent active typical p2p file-sharing apps • environment • Azureus BitTorrent app • ADSL+ 448kb upstream • OS: Windows XP Pro SP2
ISP service layer independent service datatrans-port cost-shifting between services • scenario • ISP also a higher level service provider (TV, video phone, etc) • competing with independent service providers (Skype, YouTube, etc) • capacity & QoS costs for high value services • ISP buys capacity & QoS internally • independent SP just takes as much best-efforts bandwidth as they need • because of how Internet sharing 'works' • cost of heavy usage service subsidised by ISP's lighter users
before afterupgrade most users hardly benefitfrom bottleneck upgrade data limited flowswant rate more than volume rate time flowactivity 80 users of attended apps still 2Mbps access each 20 users of unattended apps 1040Mbps all expect 30M/100 = 300k morebut most only get 60k more
p2p quickly fills up fibre to the home Distribution of customers’ daily traffic into & out of a Japanese ISP (Feb 2005) (5GB/day equivalent to 0.46Mbps if continuous) (9%, 2.5GB) (4%, 5GB) digital subscriber line (DSL 53.6%) Changing technology sharesof Japanese access market 100Mbps fibre to the home (FTTH 46.4%) Courtesy of Kenjiro Cho et al [Cho06]The Impact and Implications of the Growth in Residential User-to-User Traffic, SIGCOMM (Oct ’06)
1040Mbps consequence #1higher investment risk • recall • but ISP needs everyone to pay for 300k more • if most users unhappy with ISP A’s upgrade • they will drift to ISP B who doesn’t invest • competitive ISPs will stop investing... all expect 30M/100 = 300k morebut most only get 60k more
consequence #2trend towards bulk enforcement • as access rates increase • attended apps leave access unused more of the time • anyone might as well fill the rest of their own access capacity • operator choices: • either continue to provision sufficiently excessive shared capacity • or enforce tiered volume limits see joint industry/academia (MIT) white paper “Broadband Incentives” [BBincent06]
consequence #3networks making choices for users • characterisation as two user communities over-simplistic • heavy users mix heavy and light usage • two enforcement choices • bulk: network throttles all a heavy user’s traffic indiscriminately • encourages the user to self-throttle least valued traffic • but many users have neither the software nor the expertise • selective:network infers what the user would do • using deep packet inspection (DPI) and/or addresses to identify apps • even if DPI intentions honourable • confusable with attempts to discriminate against certain apps • user’s priorities are task-specific, not app-specific • customers understandably get upset when ISP guesses wrongly
DPI: de facto standard QoS mechanism • for many ISPs ‘network processing’ boxes are central to QoS • but DPI fights the IP architecture, with predictably poor results • DPI can only work if it can infer customer priorities from the app • QoS with no API and only a ‘busy-period’ notion of congestion
underlying problemsblame our choices, not p2p • commercial Q. what is cost of network usage? A. volume? NO; rate? NO A. 'congestion volume' • our own unforgivable sloppiness over what our costs are • technical • lack of cost accountability in the Internet protocol (IP) • p2p file-sharers exploiting loopholes in technology we've chosen • we haven't designed our contracts & technology for machine-powered customers
costs • infrastructure costs: sunk • operational costs: usage independent • usage and congestion: cost operator nothing • congestion: costs those sharing each resource • approximations to congestion metrics • by time: time-of-day volume pricing • by route: on/off-net, domain hops, distance • by class of service: flat fee for each class, volume price for each class • accurate congestion metrics (in all 3 dimensions) • loss rate • explicit congestion notification…
note: diagram is conceptual congestion volume would be accumulated over time capital cost of equipment would be depreciated over time not volume, butcongestion volume: the missing metric • not ‘what you got’but ‘what you unsuccessfully tried to get’ • proportional to what you got • but also to congestion at the time • congestion volume: cost to other users • the marginal cost of upgrading equipment • so it wouldn’t have been congested • so your behaviour wouldn’t have affected others • competitive market matches 1 & 2 NOTE: congestion volume isn’t an extra cost • part of the flat charge we already pay • it's just the wrong people are paying it • if we could measure who to blame for itwe might see pricing like this...
bit rate x1(t) core of solutioncongestion harm (cost) metric user1 user2 x2(t) • bit rate weighted by each flow’s congestion, over time congestion volume, v p(t)xi(t) dt summed over all a sender’s flows • result is easy to measure per flow or per user • volume of bytes discarded (or ECN marked) • a precise instantaneous measure of harm, counted over time • a measure for fairness over any timescale • and a precise measure of harm during dynamics • intuition: volume is bit rate over time volume, V xi(t) dt summed over all a sender’s flows • network operators often count volume only over peak period • as if p(t)=1 during peak and p(t)=0 otherwise loss (marking) fraction p(t)
u1 450kbps u2 toy scenario rate, x1 300kbs-1 congestion volume metrictoy example time, t 200kbs-1 0 100ms 200ms • cost of one user’s behaviour on other users • congestion volume instantaneous congestion p... • ...shared proportionately over each user’s bit rate, xi • ...over (any) time vi p(t)xi(t) dt • example v1 = 10% x 200kbs-1 x 50ms + 10% x 300kbs-1 x 100ms = 1kb + 3kb = 4kb v2 = 10% x 300kbs-1 x 50ms + 10% x 200kbs-1 x 100ms = 1.5kb + 2kb = 3.5kb x2 300kbs-1 200kbs-1 p 10% • toy scenario for illustration only; strictly... • a super-linear marking algorithms to determine p is preferable for control stability • the scenario assumes we’re starting with full buffers
gi slope p q xi usage vs subscription prices Pricing Congestible Network Resources [MacKieVarian95] • assume competitive providers buy capacity K [b/s] at cost rate [€/s] of c(K) • assume they offer a dual tariff to customer i • subscription price q[€/s] • usage price p[€/b] for usage xi[b/s], then charge rate [€/s], gi = q + pxi • what’s the most competitive choice of p & q? • where eis elasticity of scale • if charge less for usage and more for subscription,quality will be worse than competitors • if charge more for usage and less for subscription,utilisation will be poorer than competitors c K average cost marginal cost c K
for example • if a 10Gb/s link interface costs €1000 • and it costs €67 to upgrade to 11Gb/s* • average cost = €100 per Gb/s • marginal cost ~ €67 per Gb/s • ie usage revenue covers marginal cost subscription revenue covers the rest average cost€100 per Gb/s marginal cost€67 per Gb/s c €1000 K 10Gb/s * obviously not practical to physically upgrade in such small steps
problems using congestion in contracts • loss: used to signal congestion since the Internet's inception • computers detect congestion by detecting gaps in the sequence of packets • computers can hide these gaps from the network with encryption • explicit congestion notification [ECN]: standardised into TCP/IP in 2001 • approaching congestion, a link marks an increasing fraction of packets • implemented in Windows Vista (but off by default) and Linux, and IP routers (off by default) • re-inserted ECN [re-ECN]: standards proposal since 2005 • packet delivery conditional on sender declaring expected congestion • uses ECN equipment in the network unchanged
addition of re-feedback [re-ECN] – in brief • before: congested nodes mark packets receiver feeds back marks to sender • after: sender must pre-load expected congestion by re-inserting feedback • if sender understates expected compared to actual congestion, network discards packets • result: packets will carry prediction of downstream congestion • policer can then limit congestion caused (or base penalties on it) no info info no info info no info latentcontrol before after latent control R latent control S control policer info info info &control info &control R info &control S control
packet headers network transport payload 7 5 3 6 7 9 3 2 6 5 9 8 8 4 solution step #1: ECNmake congestion visible to network layer • packet drop rate is a measure of congestion • but how does network at receiver measure holes? how big? how many? • can’t presume network operator allowed any deeper into packet than its own header • not in other networks’ (or endpoints’) interest to report dropped packets • solution: Explicit Congestion Notification (ECN) • mark packets as congestion approaches - to avoid drop • already standardised into IP (RFC3168 – 2001) • implemented by most router vendors – very lightweight mechanism • but rarely turned on by operators (yet) – mexican stand-off with OS vendors
9 7 5 3 2 6 feedback congestion 3% red 0% 8 4 feedback new information visibility problemECN is not enough 2 3 4 5 6 7 8 9 NB • path congestion only measurable at exit • can’t measure path congestion at entry • can’t presume allowed deeper into feedback packets NA R S
re-feedback feedback 3% 3% 2.6% black– red 0.4% red 3% solution step #2: re-ECNmeasurable downstream congestion IPv4 header NB • sender re-inserts feedback by marking packets black • at any point on path,diff betw fractions of black & red bytes is downstream congestion • ECN routers unchanged • black marking e2e but visible at net layer for accountability NA R1 S1 re-ECN fraction resourceindex 0%
proposed re-ECN service model • to encourage sender (or proxy) to indicate sufficient expected congestion... • Internet won’t try to deliver packet flows beyond the point where more congestion has been experienced than expected • if sender wants to communicate, has to reveal expected congestion • even if sender not trying to communicate (e.g. DoS) packets can be dropped rather than enqueued before they add to congestion 3% 2% resourceindex 0% downstream congestionblack– red 3%
egressdropper = policer dropper = NB NA R1 ND S1 egress dropper (sketch) cheating sender or receiverunderstates black code-pointrate • drop enough traffic to make fraction of red = black • goodput best if rcvr & sender honest about feedback & re-feedback 2% 2% x2/3 98% 95% 3% 0 …i… n
Acceptable Use Policy Your 'congestion volume' allowance: 1GB/month (= 3kb/s continuous)This only limits the traffic you can try to transfer above the maximum the Internet can take when it is congested. Under typical conditions this will allow you to transfer about 70GB per day. If you use software that seeks out uncongested times and routes, you will be able to transfer a lot more. Your bit-rate is otherwise unlimited how to limit congestionwith flat fee pricing • only throttles traffic when contribution to congestion elsewhere exceeds allowance • otherwise free to go at any bit-rate congestion· bit-rate0%· 2 Mb/s = 0.0kb/s 0.3% · 0.3Mb/s = 0.9kb/s0.1% · 6 Mb/s = 6.0kb/s 6.9kb/s Internet 0% 0.3%congestion 2 Mb/s0.3Mb/s6 Mb/s bulkcongestionpolicer 0.1%
congestion policer – one example: per-user policer NB two different customers, same deal NA R1 S1 overdraft non-interactive long flows(e.g. P2P, ftp) congestionvolumeallowance interactive short flows(e.g. Web, IM)
light light heavy heavy light heavy fairer is faster – incentivise end host behaviour bit-rate • enabler: limit congestion, not volume • then end system congestion control will quickly evolve (cf. BitTorrent DNA) • heavy usage will back away whenever light usage appears • so light usage can go much faster • hardly affecting completion times of heavy usage • differentiated QoS as if in the network time throttling heavy usage 'unfair' TCP sharingheavier usage takeshigher sharing weight lighter usage takeshigher sharing weight
utility (value) wrt bit rate: curve families inelastic(streamingmedia) elastic(streaming) pre-1995model theoretical[Shenker95] & actual value models value€/s value€/s value€/s audio Web video p2p bit rate bit rate bit rate average of normalised curves from a set of experiments on paying customers [Hands02]
charge value customersurplus increasingprice €/b networkrevenue bit rate net value = value – charge€/s net value bit rate bit rate value – cost: customer’s optimisation [Kelly98] value€/s charge€/s bit rateb/s
varyingprice n congestion pricing probability drop 1 mark ave queue length n n • volume charging • but only of marked packets • congestion charging n n n n value charge bit rate price bit rate
(shadow)price = ECN n probability drop n networkalgorithm supply 1 s senderalgorithms demand mark ave queue length maximises social welfare across whole Internet [Kelly98, Gibbens99] DIY QoS [Gibbens99] price n inelastic(audio) n n n s n n target rate n price s ultra-elastic(p2p) s price TCP target rate target rate
familiar? drop rate n n TCP n n s n n target rate n n probability 1 drop ave queue length drop rate drop rate s s TCP TCP • 85-95% of Internet traffic (TCP) works this way already, but • dropping not marking • senders respond voluntarilyas if congestion charged • every sender responds identically target rate target rate
legend: automatic inter-domainusage cost allocation re-ECNdownstreamcongestion marking [%] sender marks 3%of packets lightly congested link marking 0.2%of packets NA highly congested link marking 2.8%of packets NB a single marking in 2.8%of packets crossing interconnect ND flow of packets receiver NC
0|0|2|7|6|0|5 legend: interconnect aggregation simple internalisation of all externalities'routing money' re-ECNdownstreamcongestion marking [%] area =instantaneous downstream congestion volume bit rate NA € NB € ND solution just two counters at border,one for each direction meter monthly bulk volumeof only marked packets = aggregate downstreamcongestion volume in flows without measuring flows € NC
NB NA ND R1 NC S1 congestion competition – inter-domain routing • why won’t a network overstate congestion? • upstream networks will route round more highly congested paths • NA can see relative costs of paths to R1 thru NB & NC • also incentivises new provision • to compete with monopoly paths down-stream routecost,Qi faked congestion ? resourcesequenceindex,i routingchoice
minimal operational support system impact • single bulk contractual mechanism • for end-customers and inter-network • also designed to simplify layered wholesale/retail market • automated provisioning • driven by per-interface ECN stats – demand-driven supply • automated inter-network monitoring & accounting • QoS an attribute of customer contract not network • automatically adjusts to attachment point during mobility
summary so farcongestion accountability – the missing link • unwise NGN obsession with per-session QoS guarantees • scant attention to competition from 'cloud QoS' • rising general QoS expectation from the public Internet • cost-shifting between end-customers (including service providers) • questionable economic sustainability • 'cloud' resource accountability is possible • principled way to heal the above ills • requires shift in economic thinking – from volume to congestion volume • provides differentiated cloud QoS without further mechanism • also the basis for a far simpler per-session QoS mechanism • having fixed the competitive environment to make per-session QoS viable next
sustainable business modelfor basic data transport usage charge capacity charge data flow value-based session business models bulkcongestionpolicer bulk monthlyusagecharging $ $ £ NC NB NA S1 R2 ND monthlycapacitycharging ¥ € £ $ usage flat fee+ capacity flat feeflat monthly fee can then be built (and destroyed) over this bulkcongestionpolicer bulk monthly usagecharging $ $ £ NC NB NA R1 S2 ND monthlycapacitycharging ¥ € £ $
Internet QoSvalue-based per-session charging Bob Briscoe
session chargeusage charge capacity charge data flow example sustainable business modelfor basic data transport & sessions persessioncharging clearing bulk monthlyusagecharging $ $ £ NC NB NA S1 R2 ND monthlycapacitycharging ¥ € £ $ persessioncharging clearing bulk monthly usagecharging $ $ £ NC NB NA R1 S2 ND monthlycapacitycharging ¥ € £ $
session chargeusage charge capacity charge data flow more simplybill & keep persessioncharging bulk monthlyusagecharging $ $ £ NC NB NA S1 R2 ND monthlycapacitycharging ¥ € £ $ persessioncharging bulk monthly usagecharging $ $ £ NC NB NA R1 S2 ND monthlycapacitycharging ¥ € £ $
what's the added value to sessions? • insurance – risk brokerage • once admitted, a session will complete • at a fixed per session price (per service, per time, etc) • low loss, low jitter • even for high & variable bandwidth • video, audio • re-ECN proposal is not 'carrier grade' • but with two tweaks it is • pre-congestion notification [PCN] • admission control • both are also built on similar simple economic principles...