Understanding Hypothesis Testing in Inferential Statistics
This guide elaborates on the essential techniques of inferential statistics, focusing on hypothesis testing to make generalizations from samples. It outlines a 5-step process to assess if a sample is representative of a population, emphasizing the importance of selecting the right sampling distribution (Z or t) based on sample size. The document details the calculation of test statistics, setting levels of significance, and making decisions regarding null and alternative hypotheses. It also addresses the implications of Type I and Type II errors in statistical conclusions.


Understanding Hypothesis Testing in Inferential Statistics
E N D
Presentation Transcript
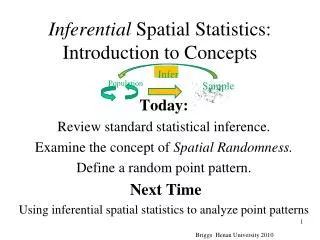
Inferential statistics: • 1. Techniques for making generalizations from samples.
Hypothesis testing: • 1. Determining if the sample is representative enough of the population so that an inference can be made.
5-step process for refuting chance (sampling error): • 1st. Identify the characteristics of data collected, I.e., variables
2nd State your hypothesis: • (a) research or alternate hypothesis, i.e., the expected relationship • (b) null hypothesis, i.e., statement of no relationship, no association, or independence
3rd Select sampling distribution: • Use a Z distribution, whenever N is greater than 120 • Use a t distribution whenever N is 120 or less 3. Use a one-tail test—if the direction of the difference can be predicted 4. Use a two-tailed test—if direction cannot be predicted
4th calculate test statistic: Calculate the outcome for your sample, e.g., regression, chi-square etc.
Level of Significance: • The probability of drawing by chance an unlikely sample outcome. You can set the alpha at any level, but the convention is to set at .01 or .05 2. Alpha = .01 means 1 out of 100 samples(times) you would be wrong to conclude that the sample differs from the population 3. Alpha = .05, i.e., 5 out 100 samples, etc
Critical region: 1. Rejection region. Once alpha level is selected, you can determine the sample outcome that begins the critical region by using the table--
5th make decision on null and research hypotheses: • Decision on Ho: • [ ] Reject a null hypothesis—means chance of an incorrect decision, I.e., type 1 error—is equal to the alpha level you have selected • [ ] accept (fail to reject) means chance of type 2 error
Decision on research on research hypothesis: 1. Ha= is there a statistically significant difference? yesno [ ] reject [ ] accept * If you accept then you can conclude that there is a statistically significant difference 2. Note: you would either conclude that the sample is or is not representative of the population from which it was drawn. Implications--