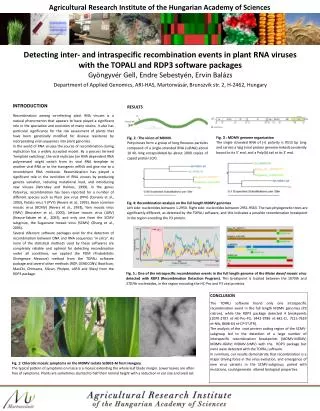
Download
1 / 17
170 likes | 297 Views
HUNGARIAN ACADEMY OF SCIENCES CROP PRODUCTION COMMITTEE SOIL SCIENCE AND AGROCHEMISTRY COMMITEE PLANT PROTECTION COMMITTEE. IV. ALPS-ADRIA SCIENTIFIC WORKSHOP 28-February-5 March 2005, Portoroz, Slovenia LIMIT VALUE OF NUTRITIONAL STATUS OF MAIZE (ZEA MAYS L.) FOR PLANT ANALYSIS

E N D
HUNGARIAN ACADEMY OF SCIENCES CROP PRODUCTION COMMITTEE SOIL SCIENCE AND AGROCHEMISTRY COMMITEE PLANT PROTECTION COMMITTEE IV. ALPS-ADRIA SCIENTIFIC WORKSHOP 28-February-5 March 2005, Portoroz, Slovenia LIMIT VALUE OF NUTRITIONAL STATUS OF MAIZE (ZEA MAYS L.) FOR PLANT ANALYSIS Zoltán Izsáki Tessedik Sámuel College Faculty of Agricultural Water and Environmental Management Szarvas
The diagnostic plant analysis can be used for the following purposes: • to determine the nutrient status of the crop and the level of nutrient supplies; • to detect interactions (antagonism, synergism) between nutrients; • to reveal latent nutritional disorders and identify visible symptoms of deficiency or excess; • to check the results of soil analysis and fertilisation practices; • to discover the reasons for developmental anomalies.
MATERIALS AND METHODS The long-term mineral fertilisation experiments were set up: in 1989, in Szarvas Soil type: chernozem meadow Fertiliser treatments: 4 levels of N, P and K fertilisers in complete combination (43), giving of total of 64 treatments Experimental design: split-split plot with 3 replications Size of the sub-sub-plots: 20 m2. Variety: Pioneer hybrid Clarica (FAO 310) Forecrop: silage sorghum Leaf samples were taken: at the beginning of tasseling, in 2001-2004 Leaf samples were analysed: N, P, K, Ca, Mg, Fe, Mn, Zn, Cu
Effect of P-fertilisation on the AL-soluble P2O5 content of the soil in cultivated layer (Szarvas, 1989-2003) AL-P2O5 mg kg-1 P3 P2 P1 P0
Effect of K-fertilisation on the AL-soluble K2O content of the soil in cultivated layer (Szarvas, 1989-2003) AL-K2O mg kg-1 K3 K2 K1 K0
RESULTS AND CONCLUSIONS Table 1. Effect of N supply on the nutrient concentrations of maize leaf (Szarvas, 2001-2004)
Table 2. Effect of P supply on the nutrient concentrations of maize leaf (Szarvas, 2001-2004)
Table 3. Effect of K supply on the nutrient concentrations of maize leaf (Szarvas, 2001-2004)
Fig. 1. Relationship between the N and Mn concentration of the maize leaf Fig. 2. Relationship between the P and Cu concentration of the maize leaf
Fig. 3. Fig. 4. Fig. 5. Fig. 3-5. Relationship between the K as well as the Mg and Cu concentration of the maize leaf
Fig. 1. Fig. 2. Fig 3. Fig. 4. Fig. 5. Fig. 1-5. Relationship between the N, P, K, Ca and Mg concentration of the maize leaf and the grain yield (Szarvas, 2001-2004)
Fig. 6. Fig. 7. Fig. 8. Fig. 9. Fig. 6-9. Relationship between the Fe, Mn, Zn and Cu concentration of the maize leaf and the grain yield (Szarvas, 2001-2004)
Table 4. Limit values for nutrient supplies to maize based on nutrient contents and ratio in the leaf at tasselling (Szarvas, 2001-2004)
CONCLUSIONS According to the experimental data, satisfactory nutrient supplies are indicated by the following diagnostic plant analysis values in maize leaves at tasselling: N 3.0-5.0 %; P 0.3-0.4 %; K 1.5-2.5 %; Ca 0.15-0.50 %; Mg 0.10-0.35 %; Fe 50-200 mg kg-1; Mn 30-150 mg kg-1; Zn 10-35 mg kg-1 and Cu 3-7 mg kg-1 (Table 4.) If these limit values, associated with high yields, are compared with data from the literature, it can be seen that the concentration range given here for N is higher, while the optimum concentrations for the other nutrients are within the range published by other authors.
n= 256 Relationship between the N concentration of the maize leaf and the grain yield (Szarvas, 2001-2004)