Download
1 / 8
80 likes | 176 Views
Comparison of motif composition in 4 PAK structures reveals structural insights and highlights domain differences between apo and holo states. This study showcases the utility of motif analysis for understanding protein function.

E N D
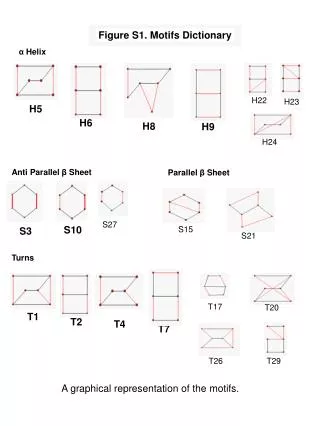
Figure S1. Motifs Dictionary α Helix H22 H23 H5 H6 H8 H9 H24 Anti Parallel β Sheet Parallel β Sheet S27 S15 S10 S3 S21 Turns T17 T20 T1 T2 T4 T7 T29 T26 A graphical representation of the motifs.
Figure S1. Motifs Dictionary (cont.) Special Motifs M14, Schellman H18, 310 Helix Novel Motifs M11 M12 H13, B10 Helix M16 M25 M19 M28 M30 A graphical representation of the motifs.
Figure S2, comparison of motif composition between 5 different p21-activated kinases (PAK structures). A 2F57 A 2F57 B aA B Green, 2F57 chain A Cyan, 2F57 chain B Red, M2 Blue, M11 Yellow, M12 Magenta, M13 Orange, M27 b1b and b2 aC
To demonstrate the applicability of the here developed SP analysis, we compare 4 different PAK structures using the SP tool as implemented in the protmot WEB server (http://bioinfo.weizmann.ac.il/protmot/). This example is based on the work published in Structure 15, 201–213, 2007. In that work, 4 similar structures of p21-activated kinases (PAK) were compared to understand the mechanism of action. The figure shows the following proteins: PDB 2bva - PAK4 apo, 2cdc – PAK4+inhibitor, 2f57 – PAK5, 2c30 – PAK6). All 4 structures have very high homology both in structure and sequence (see Fig S2B and Fig 1 in Structure 15, 201–213). The most obvious outlier between the structures is of 2bva.pdb (see Fig S2A). Indeed, the authors write that “In the apo structure of PAK4, large regions of the kinase domain were disordered”. We show here that the motif composition of 2bva.pdb is very different from the other three protein. This is true not only for the N-ter domain of the protein, but also for the C-ter domain. However, this disorder is not detected on the structure (Fig. S2). The reason for this is not obvious and may suggest some intrinsic problems either with the purified protein, or the crystallization conditions. Also interestingly is the analysis of the differences between the two chains of PAK-5, as chain A is in the apo state, while chain B is in the holo state (bound to purine, Fig S2B). Structurally, in the holo state an opening of the N-ter domain is observed, which is a result of rigid body movements of helix aC and aA from one side of the purine (Fig. S2B), and the turn made from b1b and 2 from the other side. The analysis shown in the figure between chains A and B clearly shows that while in general the two domains are similar, a number of motifs change. In particular, M2, M11 and M12 (associated to helix C), M13 (associated to helix A) and M27 (associated to b1b and 2). No significant changes in the SP of the C-ter are observed. Moreover, the motif analysis also clearly shows that the PAK-6 apo structure (2cdz) is similar to the PAK-5 apo structure (chain A) and not the purine bound structure (chain B). This analysis comes to show the value of analyzing and comparing motif composition between multiple similar structures, as is easily done using the protmot server, and that much hidden information can be learned.
B A Figure S3, comparison of motif composition between Sir2 apo and holo structures. (A) Cosgrove et al. (2006) (biochemistry 45,7511-7521) solved and compared the structures of Sir2 in the substrate bound and apo forms. The authors found the global RMSD to be poor (12.1Ǻ), but visually the structures seem highly similar (see also figure 1 of their manuscript). (B) Calculating SP, we found that the structures are indeed similar. Figure S4, Hemoglobin Network Motif Analysis (A) Overlay of the high resolution structures Human Hemoglobin (pdb 1ird) on Deer (pdb 1hds), RMSD=0.9Å and sequence identities of 73%. (B) SP of Human Hemoglobin (pdb 1ird), Horse (pdb 1iwh), Maned wolf (pdb 1fhj) and Deer (pdb 1hds). Deer profile is unlike the other mammals. (C) Ramachandran plot of Deer shows that a high percentage of residues are out of the allowed region.
Figure S5. Lysozyme H5 Dynamics Occurrence of Motif H5 Occurrence of Motif H5 % Simulation Time Fluctuations of Motif H5 in the Lysozyme simulation
Figure S6. 434 Repressor H5 Dynamics Occurrence of Motif H5 Occurrence of Motif H5 % Simulation Time Fluctuations of Motif H5 in the 434 repressor simulation
Figure S7. SH3 H6,S27 Average Dynamics H6 S27 Occurrence of Motifs H6 vs. S27 % Simulation Time Anti correlation of Motifs H6 and S27 in the Lysozyme simulation.


